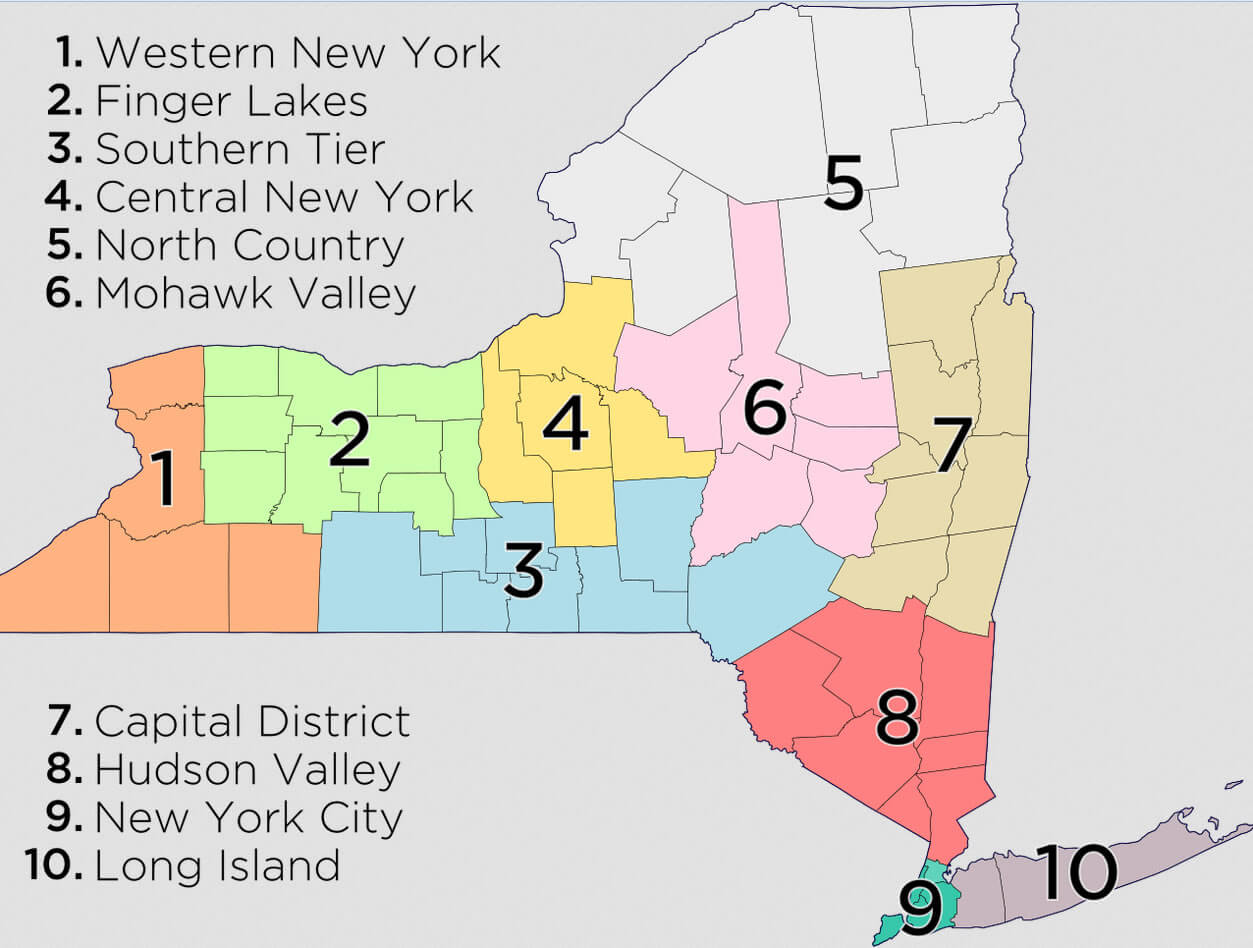
Map of New York Economic Regions Map
The New York State Department of Economic Development provides two distinct definitions of these regions. It divides the state into ten economic regions,[58] which approximately correspond to terminology used by residents:
Click for Content Detail »
| Historical population | |||
|---|---|---|---|
| Census | Pop. | %± | |
| 1790 | 340,120 | — | |
| 1800 | 589,051 | 73.2% | |
| 1810 | 959,049 | 62.8% | |
| 1820 | 1,372,812 | 43.1% | |
| 1830 | 1,918,608 | 39.8% | |
| 1840 | 2,428,921 | 26.6% | |
| 1850 | 3,097,394 | 27.5% | |
| 1860 | 3,880,735 | 25.3% | |
| 1870 | 4,382,759 | 12.9% | |
| 1880 | 5,082,871 | 16.0% | |
| 1890 | 6,003,174 | 18.1% | |
| 1900 | 7,268,894 | 21.1% | |
| 1910 | 9,113,614 | 25.4% | |
| 1920 | 10,385,227 | 14.0% | |
| 1930 | 12,588,066 | 21.2% | |
| 1940 | 13,479,142 | 7.1% | |
| 1950 | 14,830,192 | 10.0% | |
| 1960 | 16,782,304 | 13.2% | |
| 1970 | 18,236,967 | 8.7% | |
| 1980 | 17,558,072 | −3.7% | |
| 1990 | 17,990,455 | 2.5% | |
| 2000 | 18,976,457 | 5.5% | |
| 2010 | 19,378,102 | 2.1% | |
| Est. 2014 | 19,746,227 | 1.9% | |
| Sources:
2014 Estimate |
|||
Largest Cities Map of New York and Population
- New York City Map - 8.175.133 - (40.714,-74.006)
- Brooklyn Map - 2.300.664 - (40.65,-73.95)
- Manhattan Map - 1.487.536 - (40.783,-73.966)
- Buffalo Map - 261.310 - (42.886,-78.878)
- Rochester Map - 210.565 - (43.155,-77.616)
- Yonkers Map - 195.976 - (40.931,-73.899)
- Syracuse Map - 145.170 - (43.048,-76.147)
- Albany Map - 97.856 - (42.653,-73.756)
- New Rochelle Map - 77.062 - (40.91148820000,-73.78235490000)
- Cheektowaga Map - 75.178 - (42.90261360000,-78.74457200000)
- Mount Vernon Map - 67.292 - (40.91259920000,-73.83707860000)
- Schenectady Map - 66.135 - (42.81424320000,-73.93956870000)
- Utica Map - 62.235 - (43.100903, -75.232664)
- Brentwood Map - 60.664 - (40.781209, -73.246227)
- Tonawanda Map - 58.144 - (42.981389, -78.855278)
- White Plains Map - 56.853 - (41.033986, -73.762910)
- Hempstead Map - 53.891 - (40.706213, -73.618740)
- Levittown Map - 51.881 - (40.725934, -73.514292)
- Irondequoit Map - 51.692 - (43.213395, -77.579723)
- Niagara Falls Map - 50.193 - (43.096214, -79.037739)
- Troy Map - 50.129 - (42.728412, -73.691785)
- Binghamton Map - 47.376 - (42.098687, -75.917974)
- West Seneca Map - 44.711 - (42.850059, -78.799755)
- West Babylon Map - 43.213 - (40.718155, -73.354287)
- Freeport Map - 42.860 - (40.657602, -73.583184)
- Hicksville Map - 41.547 - (40.768433, -73.525125)
- Coram Map - 39.113 - (40.868710, -73.001495)
- East Meadow Map - 38.132 - (40.713990, -73.559016)
- Valley Stream Map - 37.511 - (40.664270, -73.708465)
- Brighton Map - 36.609 - (43.118590, -77.584391)
Click for Google Map »
Where Map of New York Economic Regions Map on World Map
Click for Direction »
Map of New York Economic Regions Map Road Map and Direction