US Population Density Map: High-Resolution Insights by State and County
US Population Density Map page provides a wide range of detailed and high-resolution maps that make it easy to understand population distribution across the country. From a high-resolution United States population density heatmap to a detailed USA county-level population density map, it includes multiple visual formats such as a USA population density blue gradient map, dot distribution map, and multicolor choropleth map, offering a complete view from different perspectives.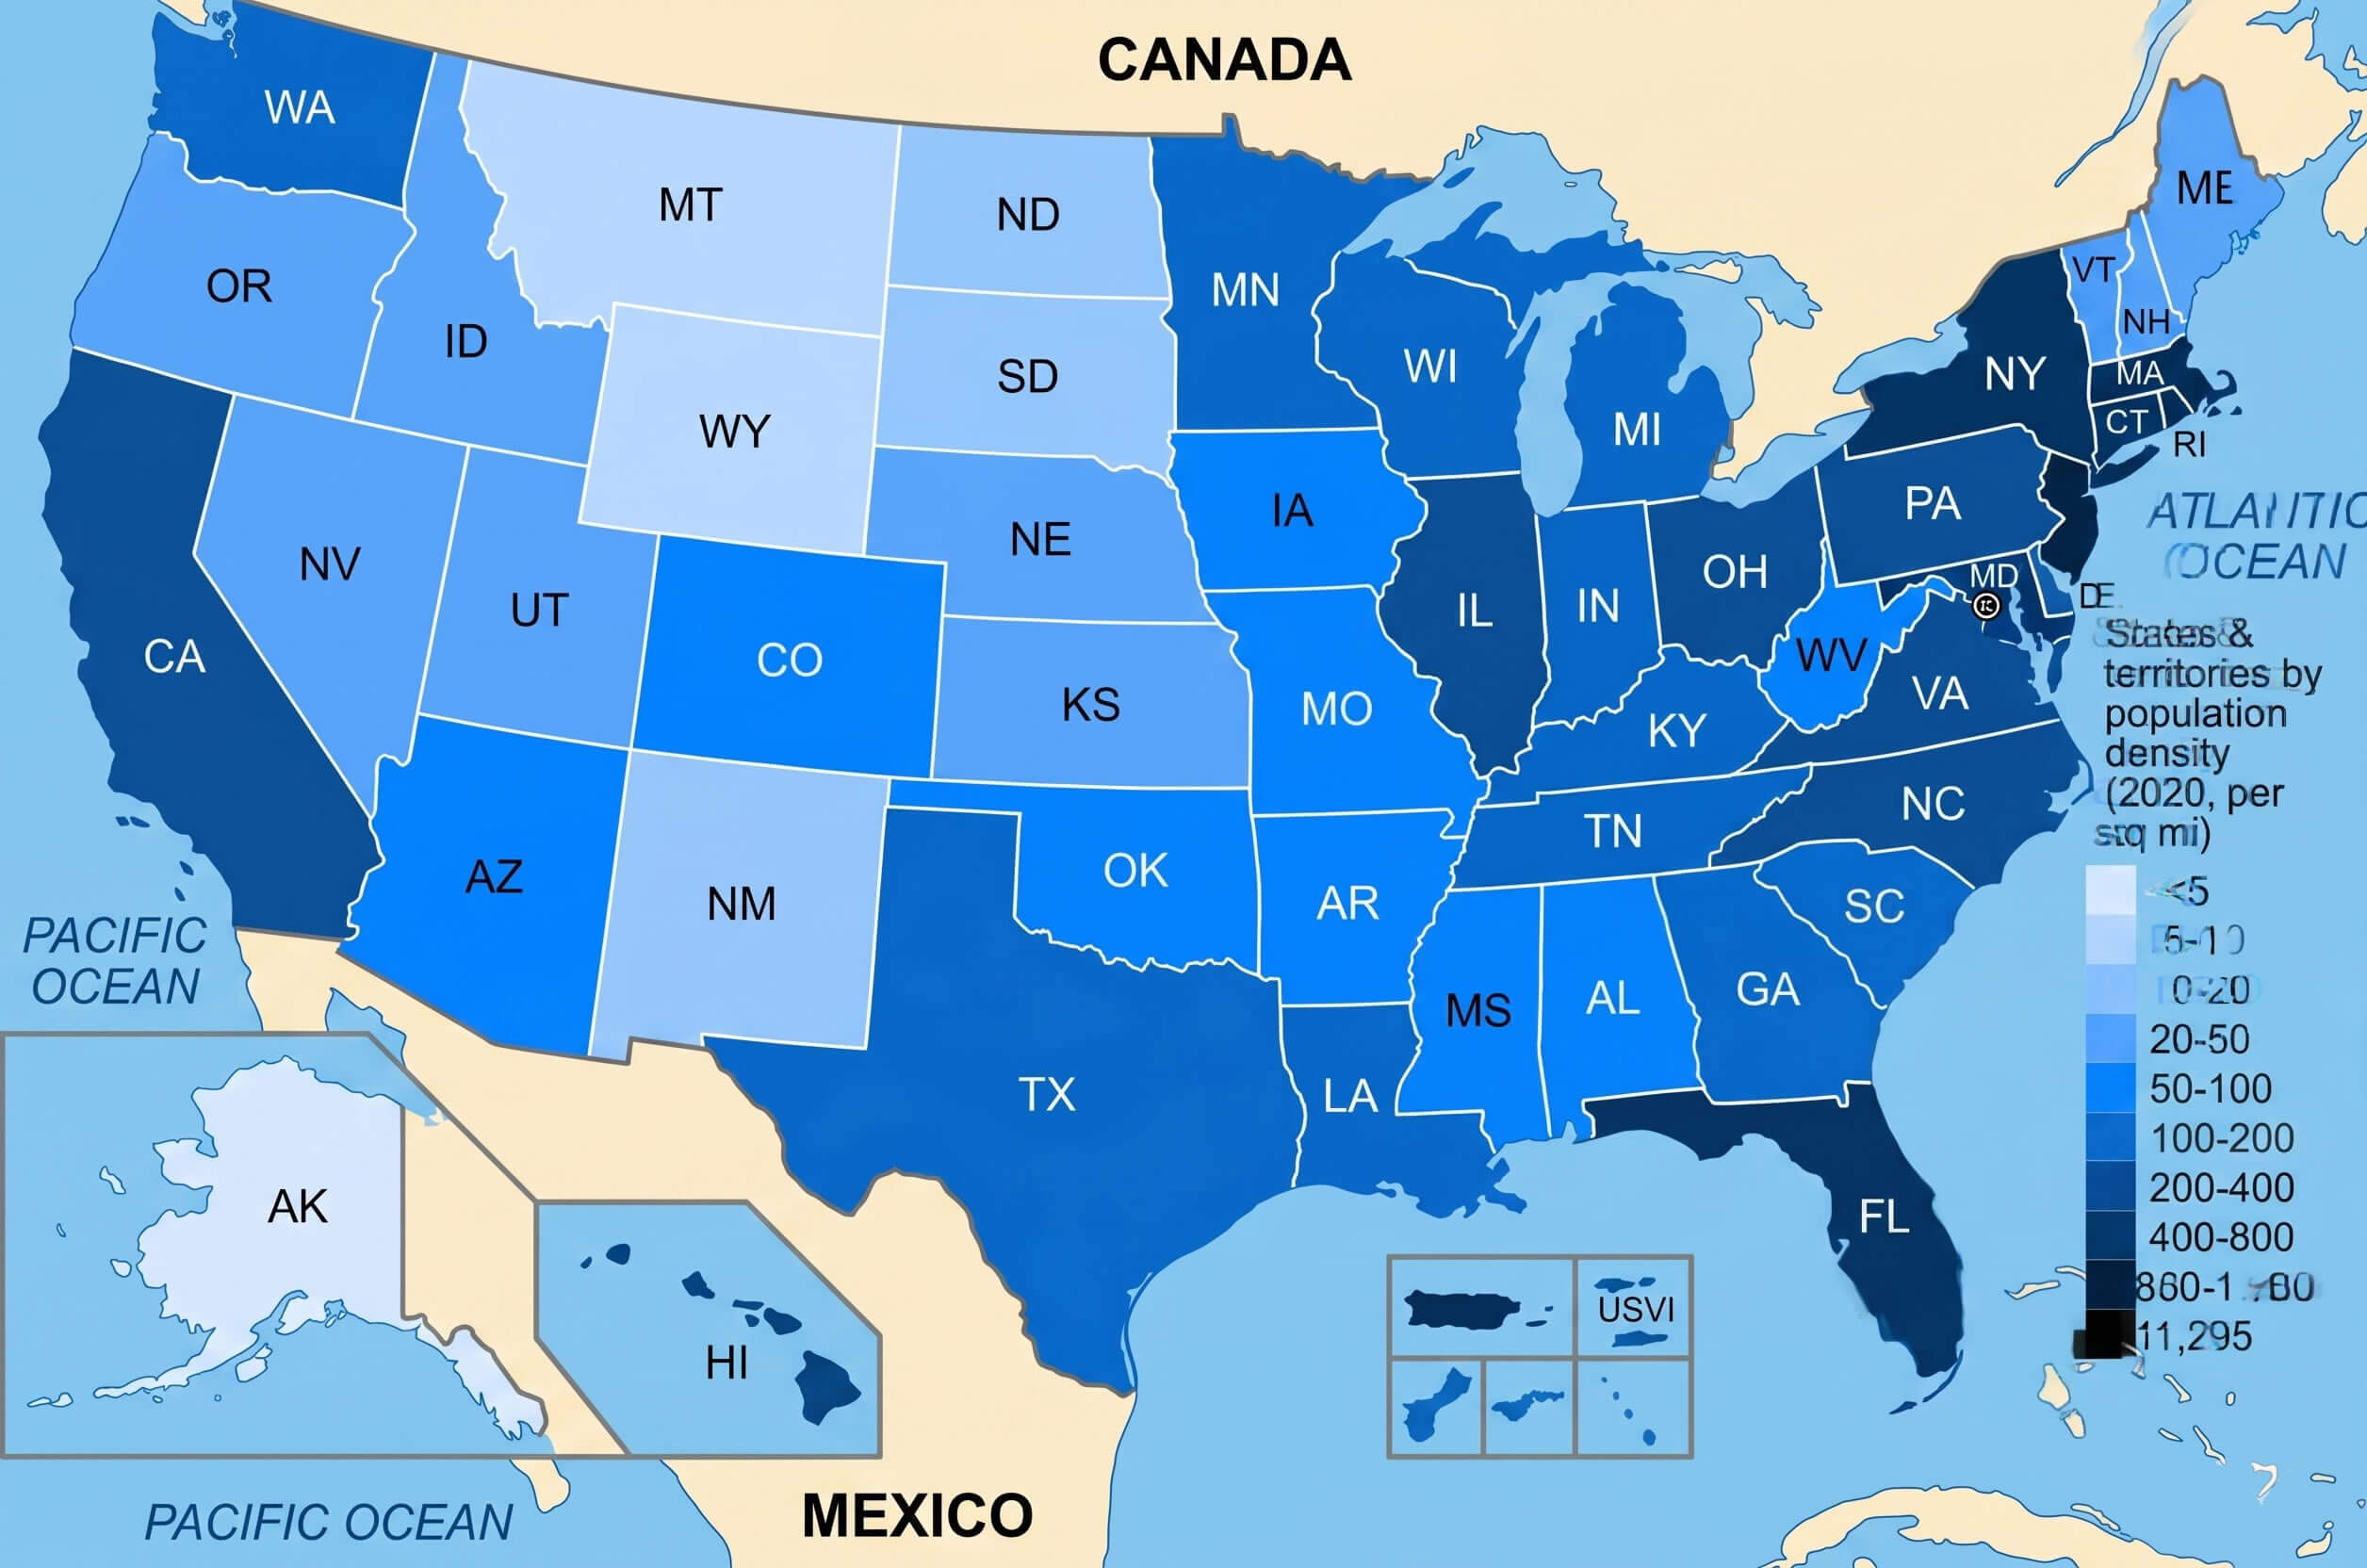
US population density map
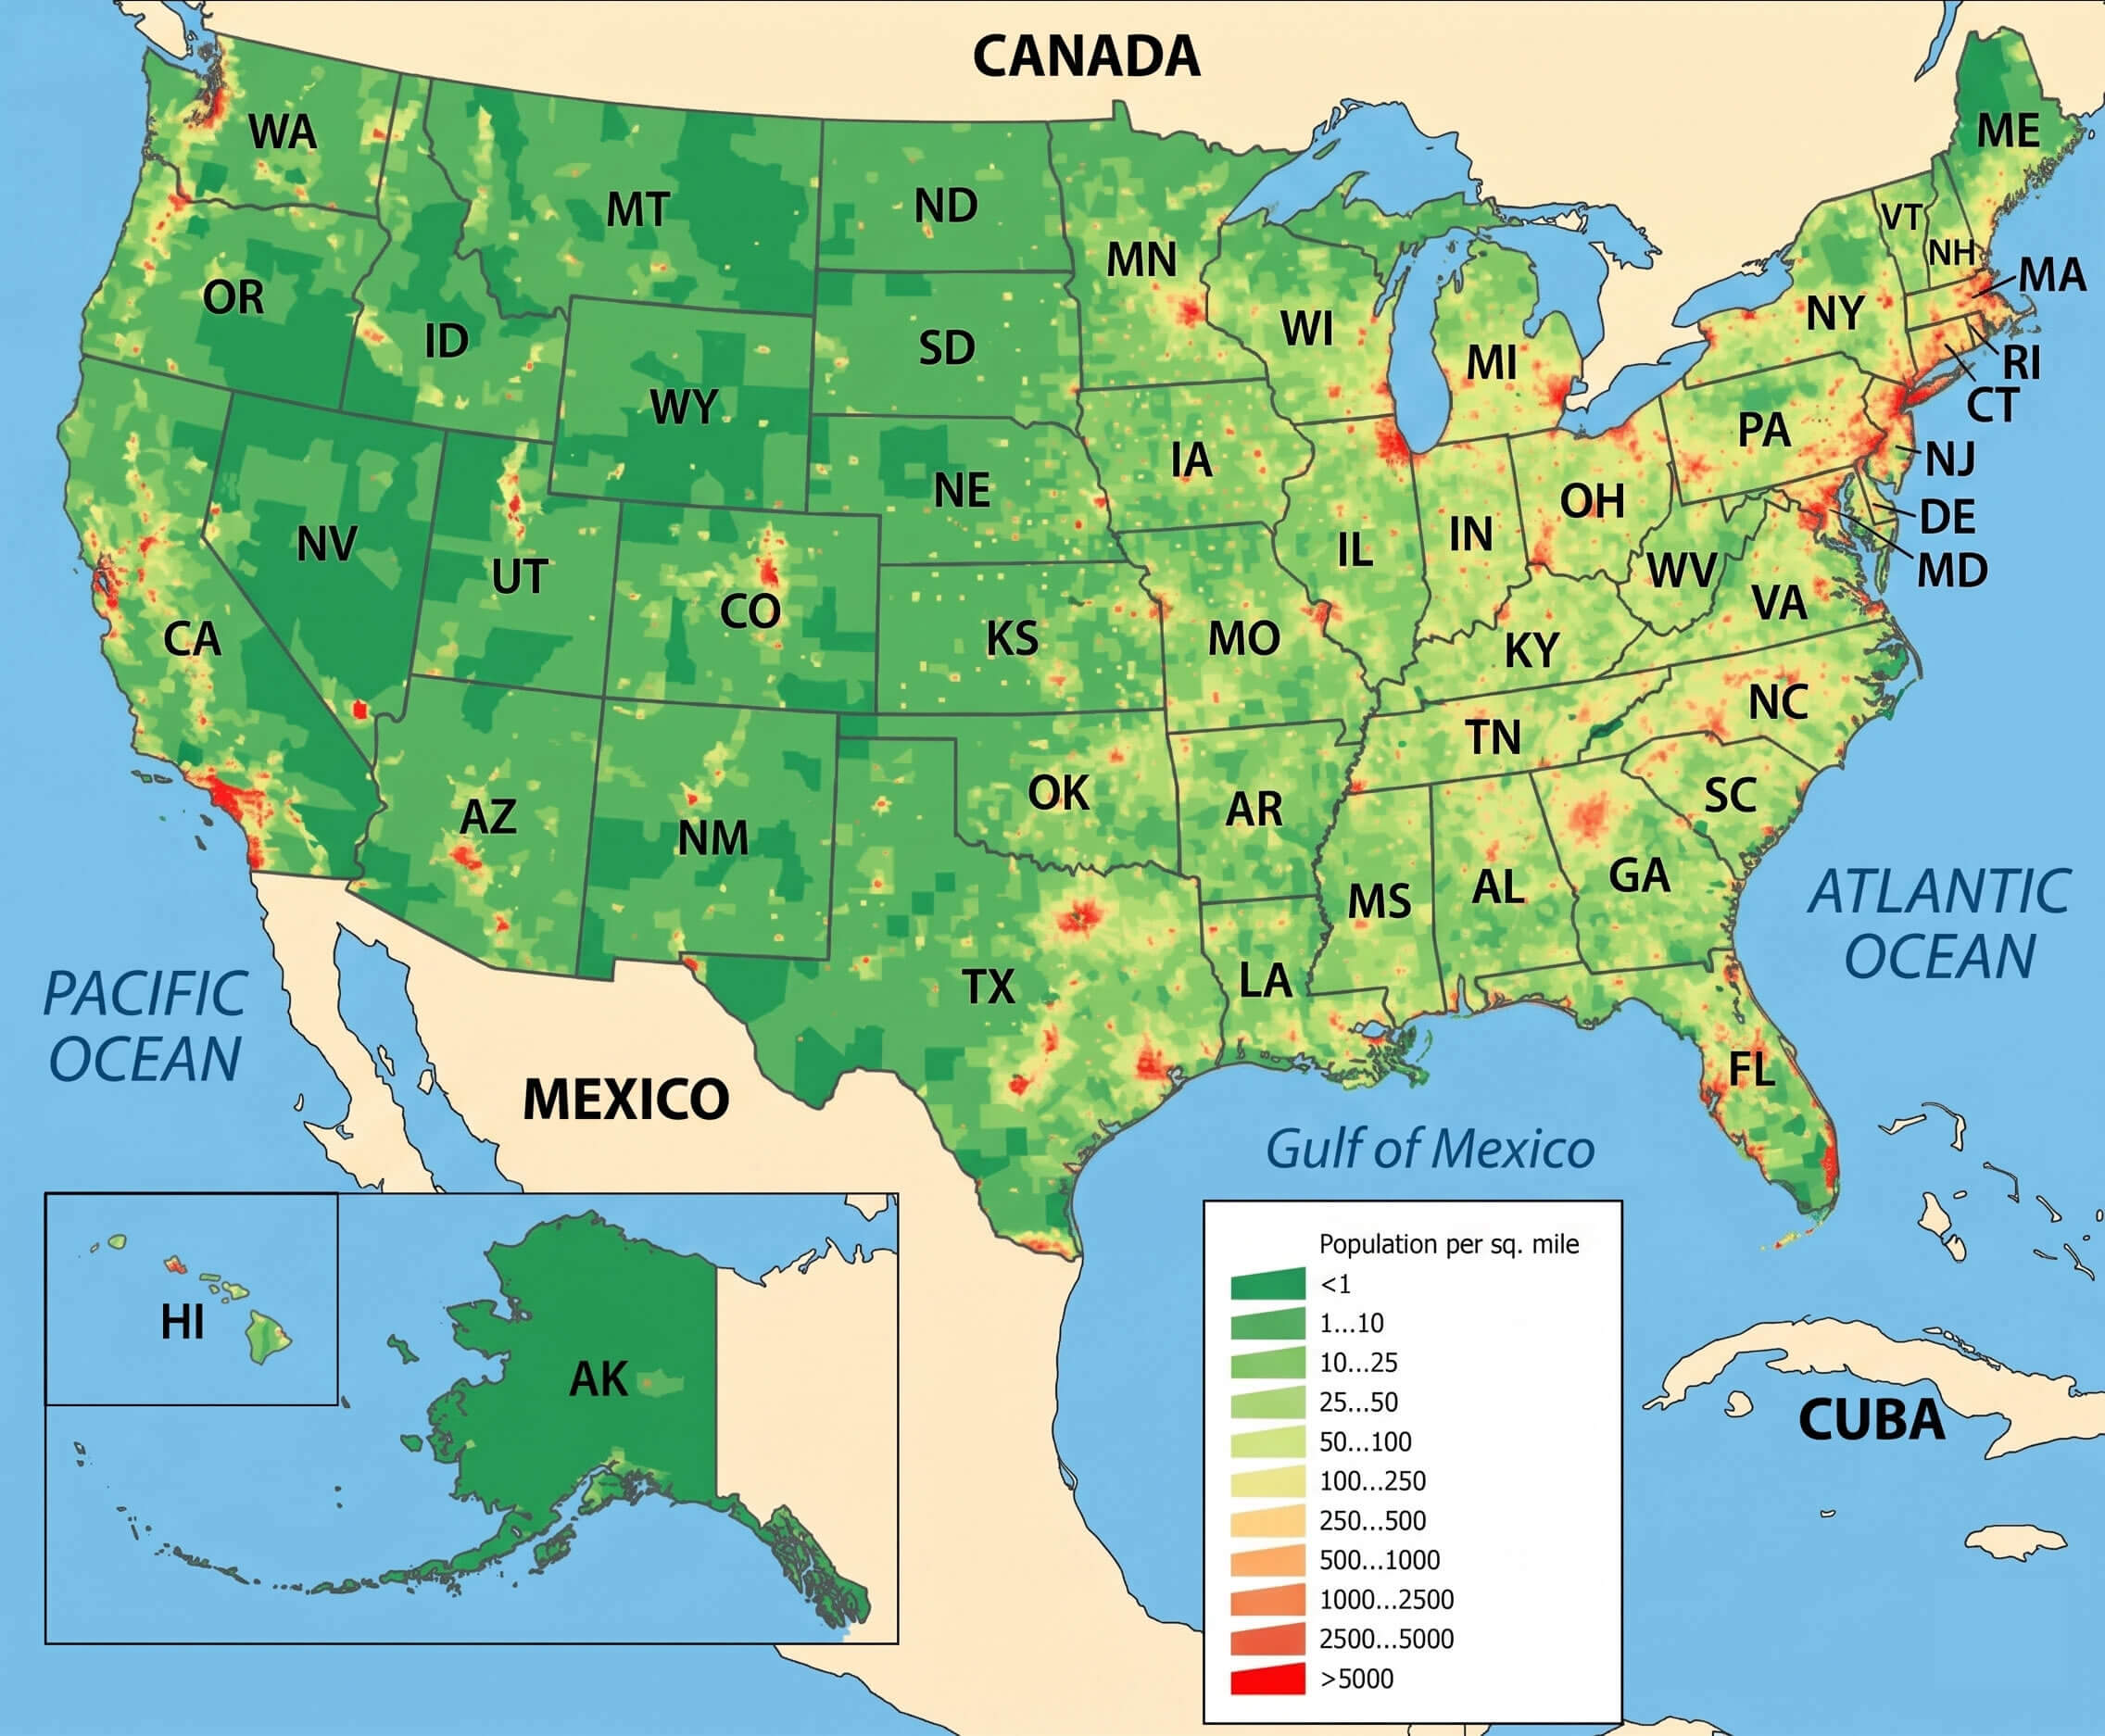
United States population density heatmap high resolution
US urban population density clusters map
You can also examine historical trends with maps such as US population density westward expansion 1940 map and US population growth 1930 to 1940 map, alongside modern insights like the US state population map 2024 and Top 10 most populous US states bar chart. Additional resources include the US population density by county 2010 census map, US population density infographic, and US urban population density clusters map, as well as broader comparisons like the North America population density map US Canada and World population density map global comparison, making this page a complete guide to understanding demographic distribution in the United States.
US state population growth and distribution map
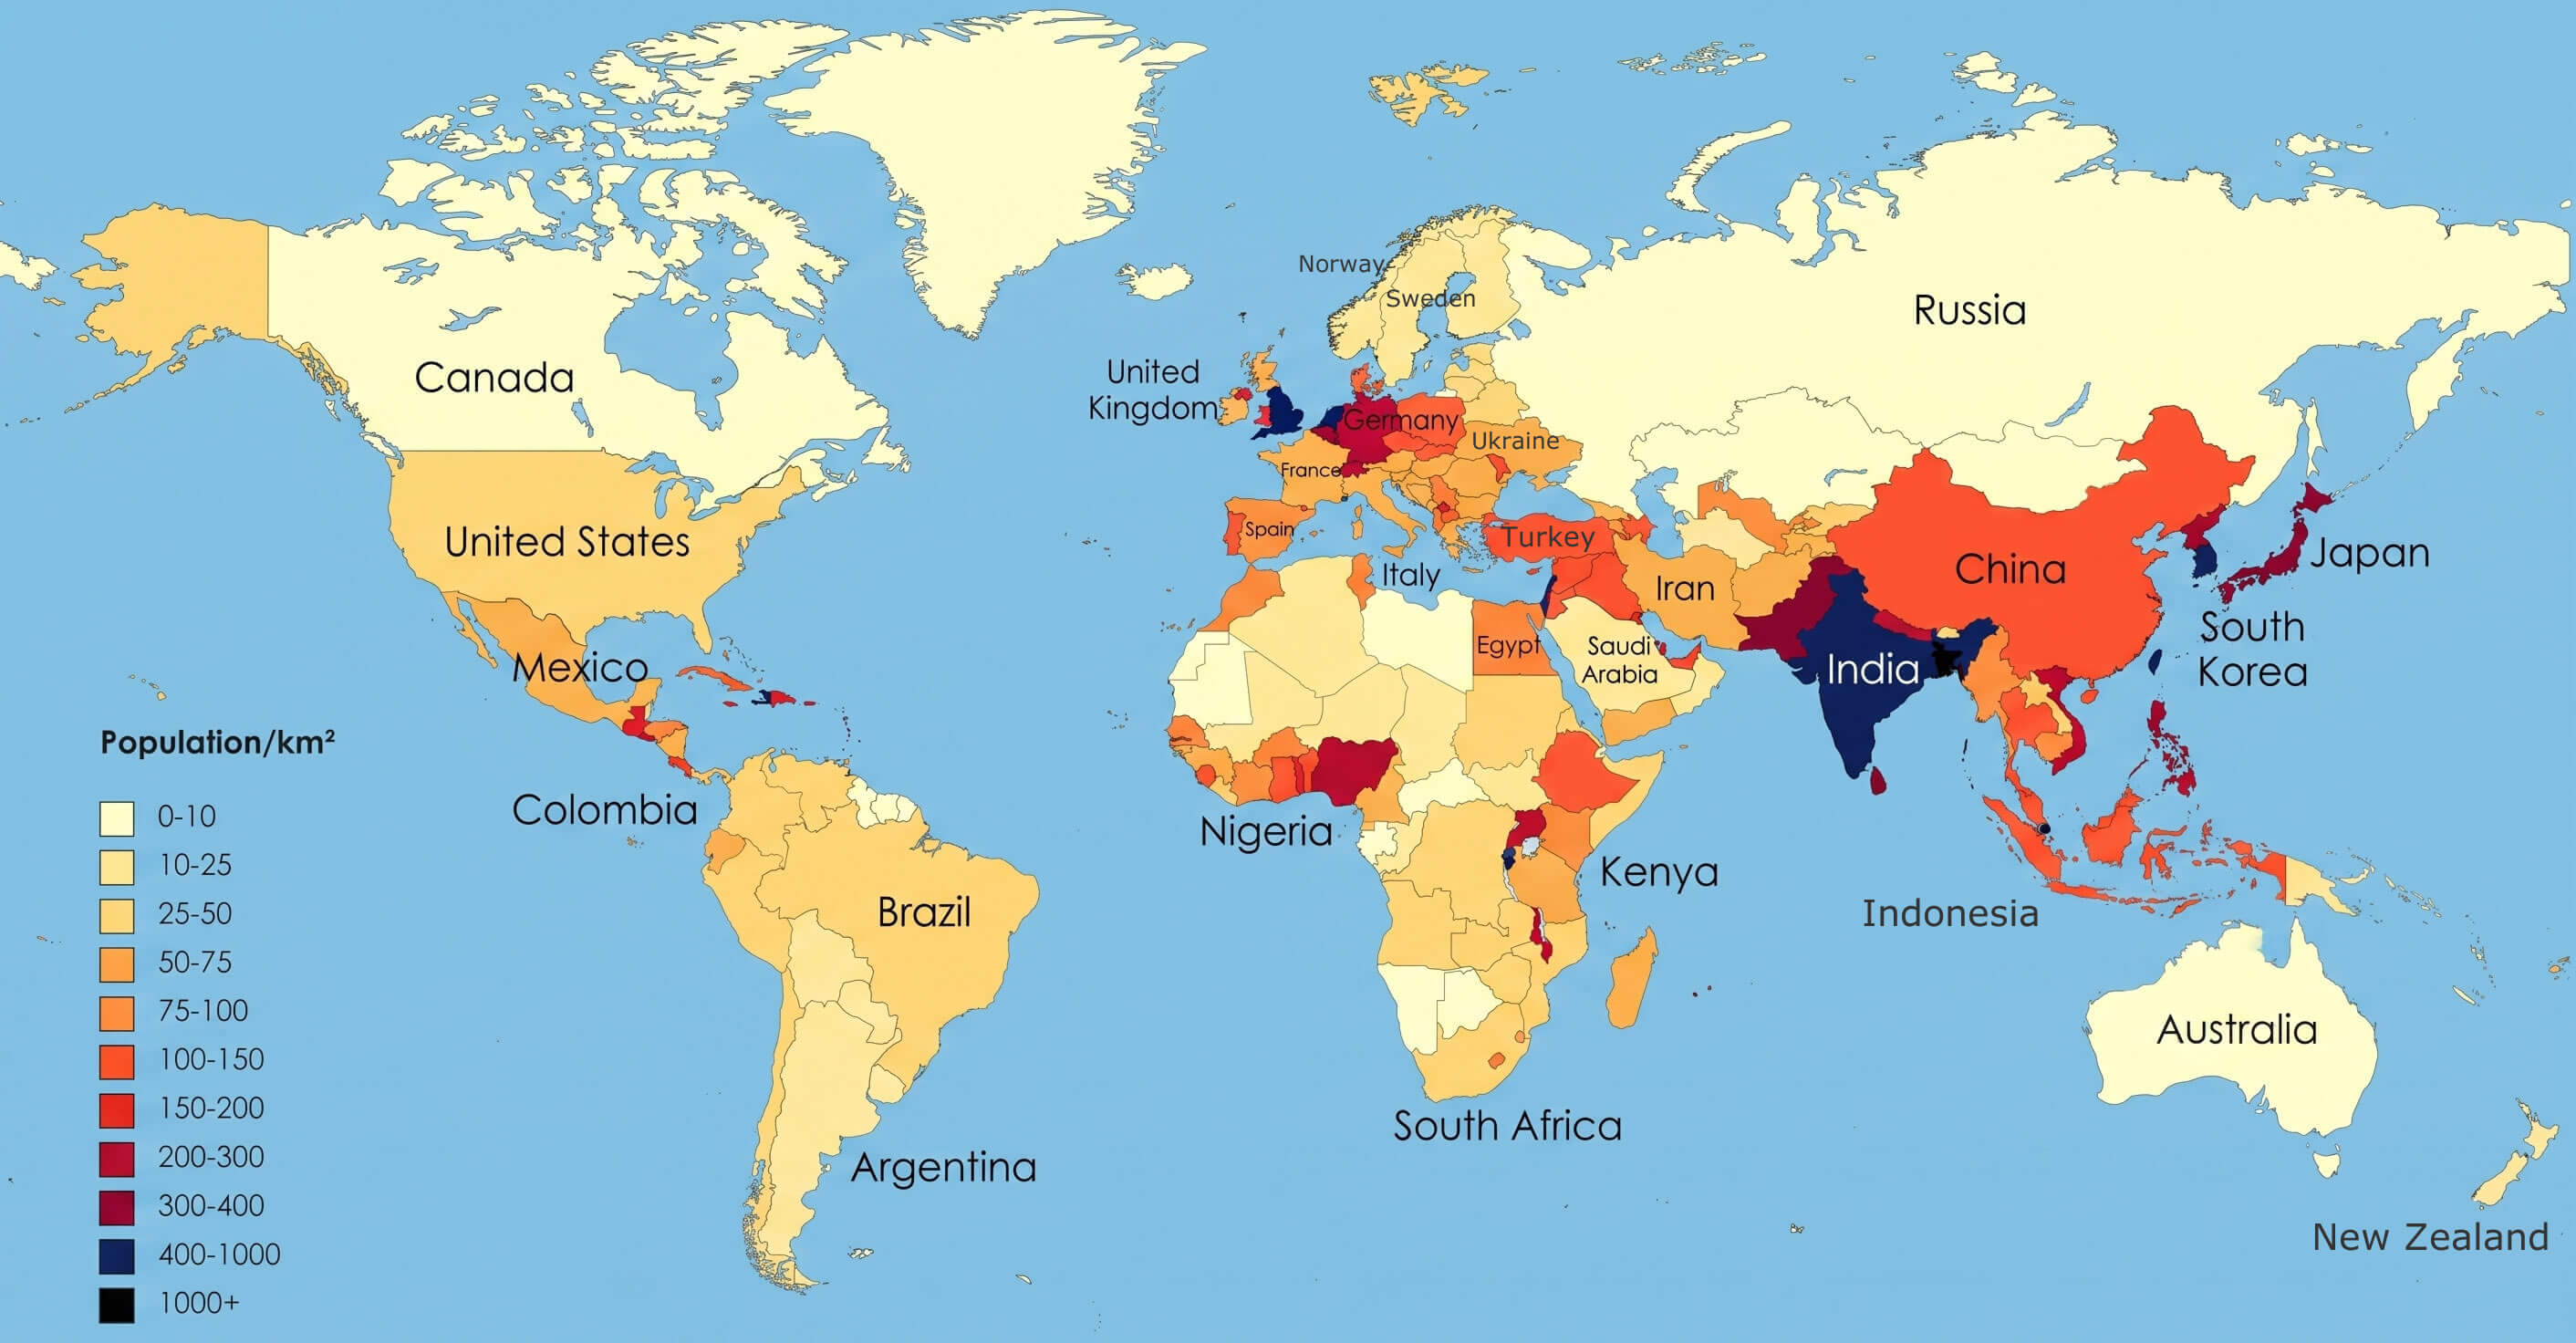
World population density map Global comparison with United States
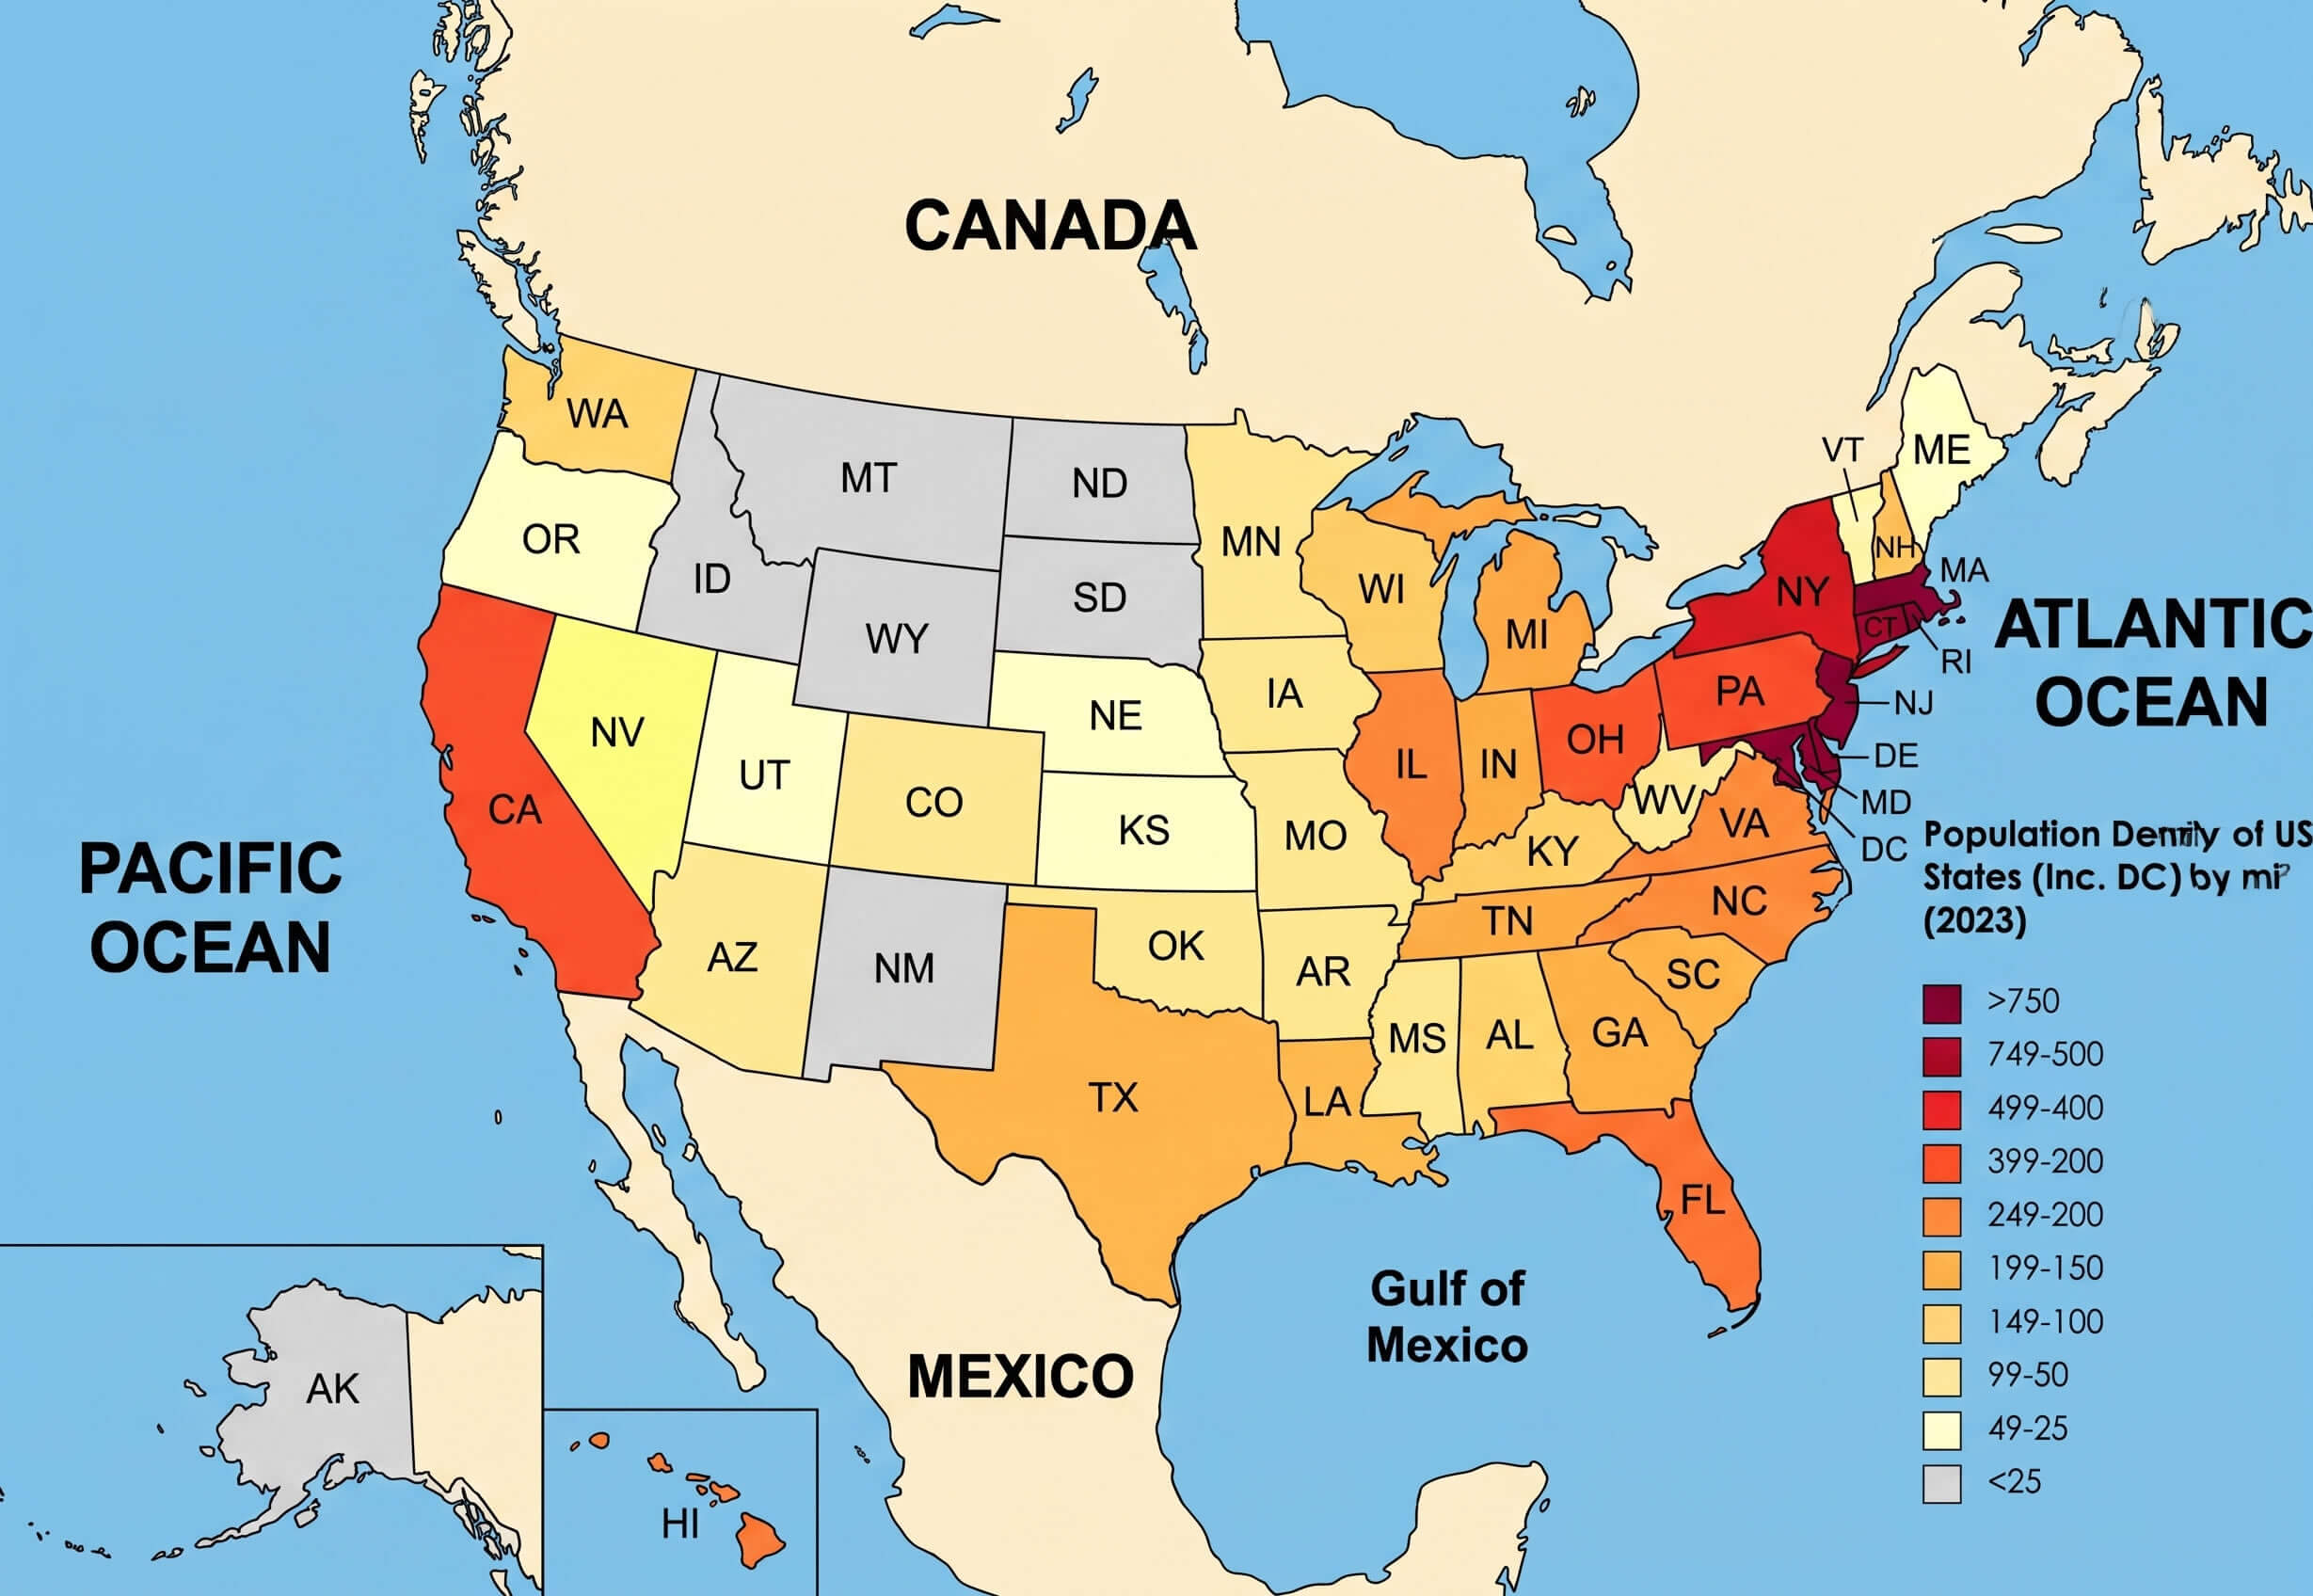
US population density map with states
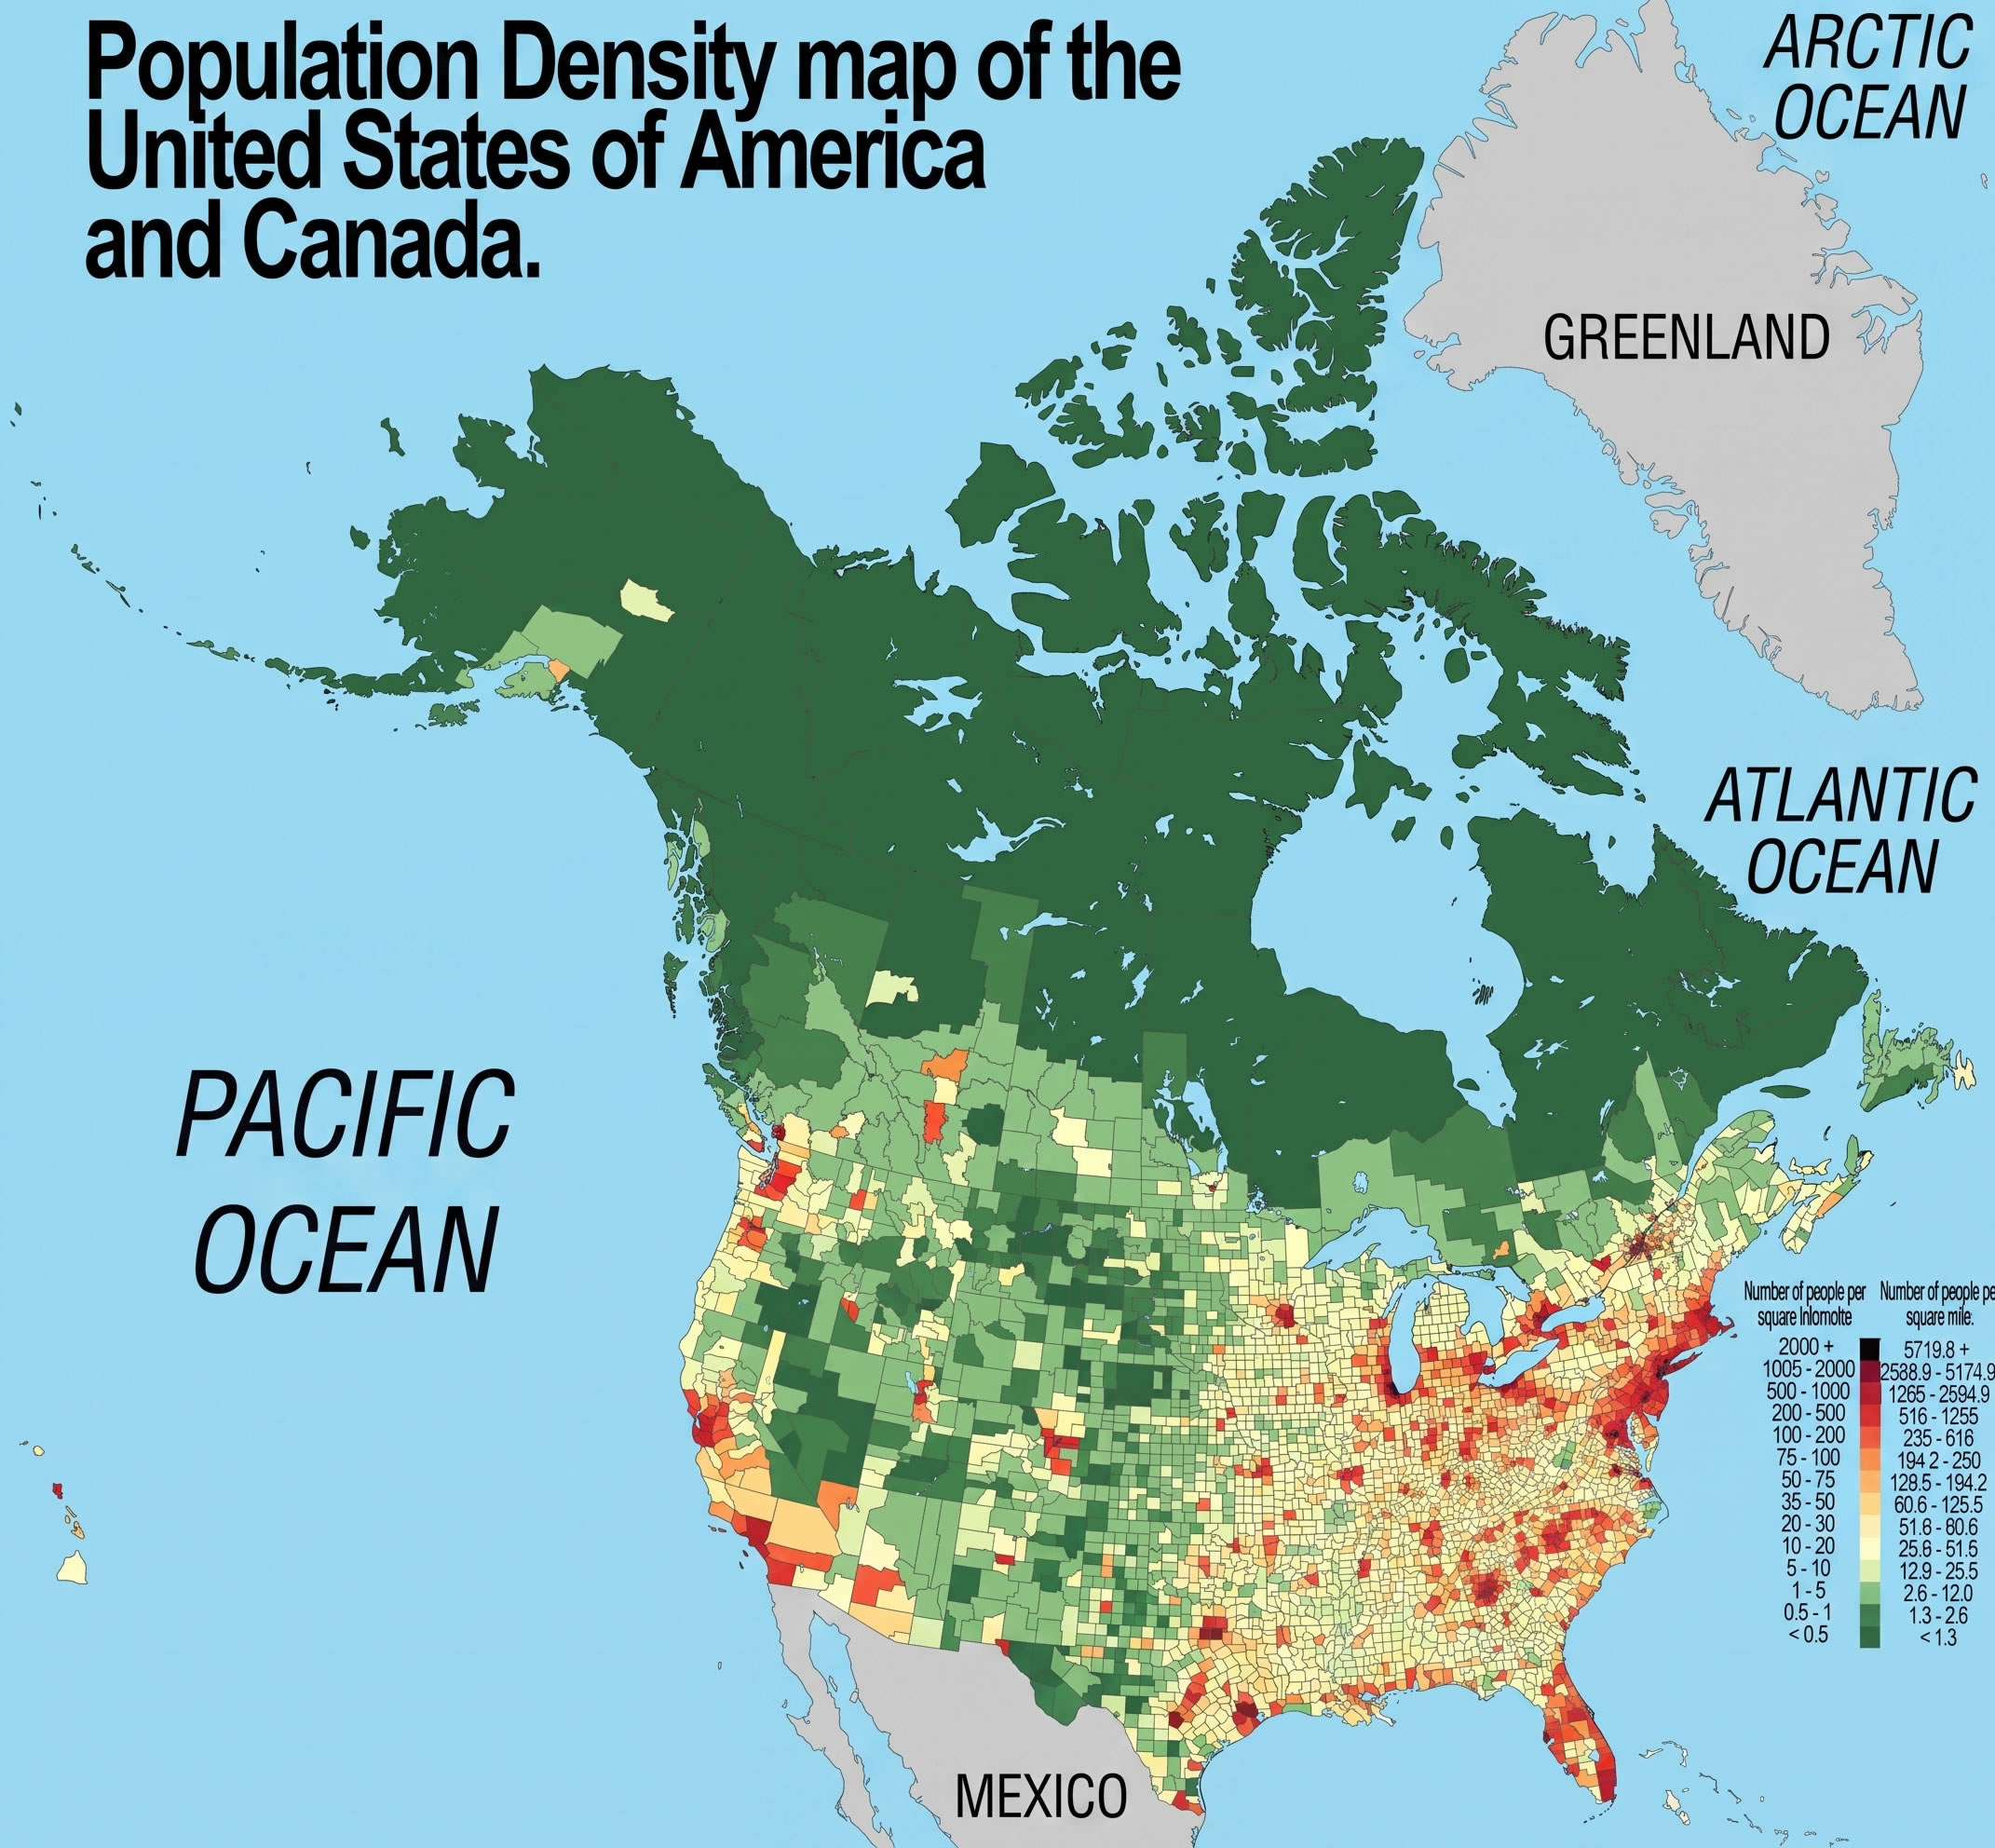
North America population density map US canada
Top 10 most populous US states bar chart
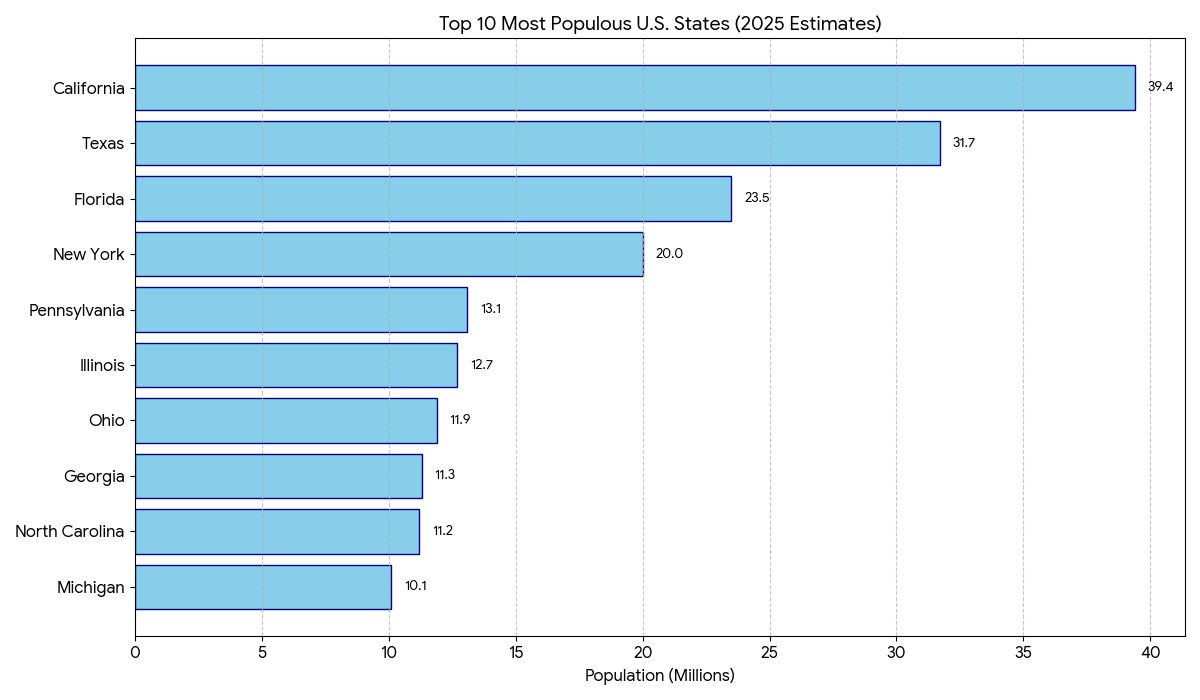
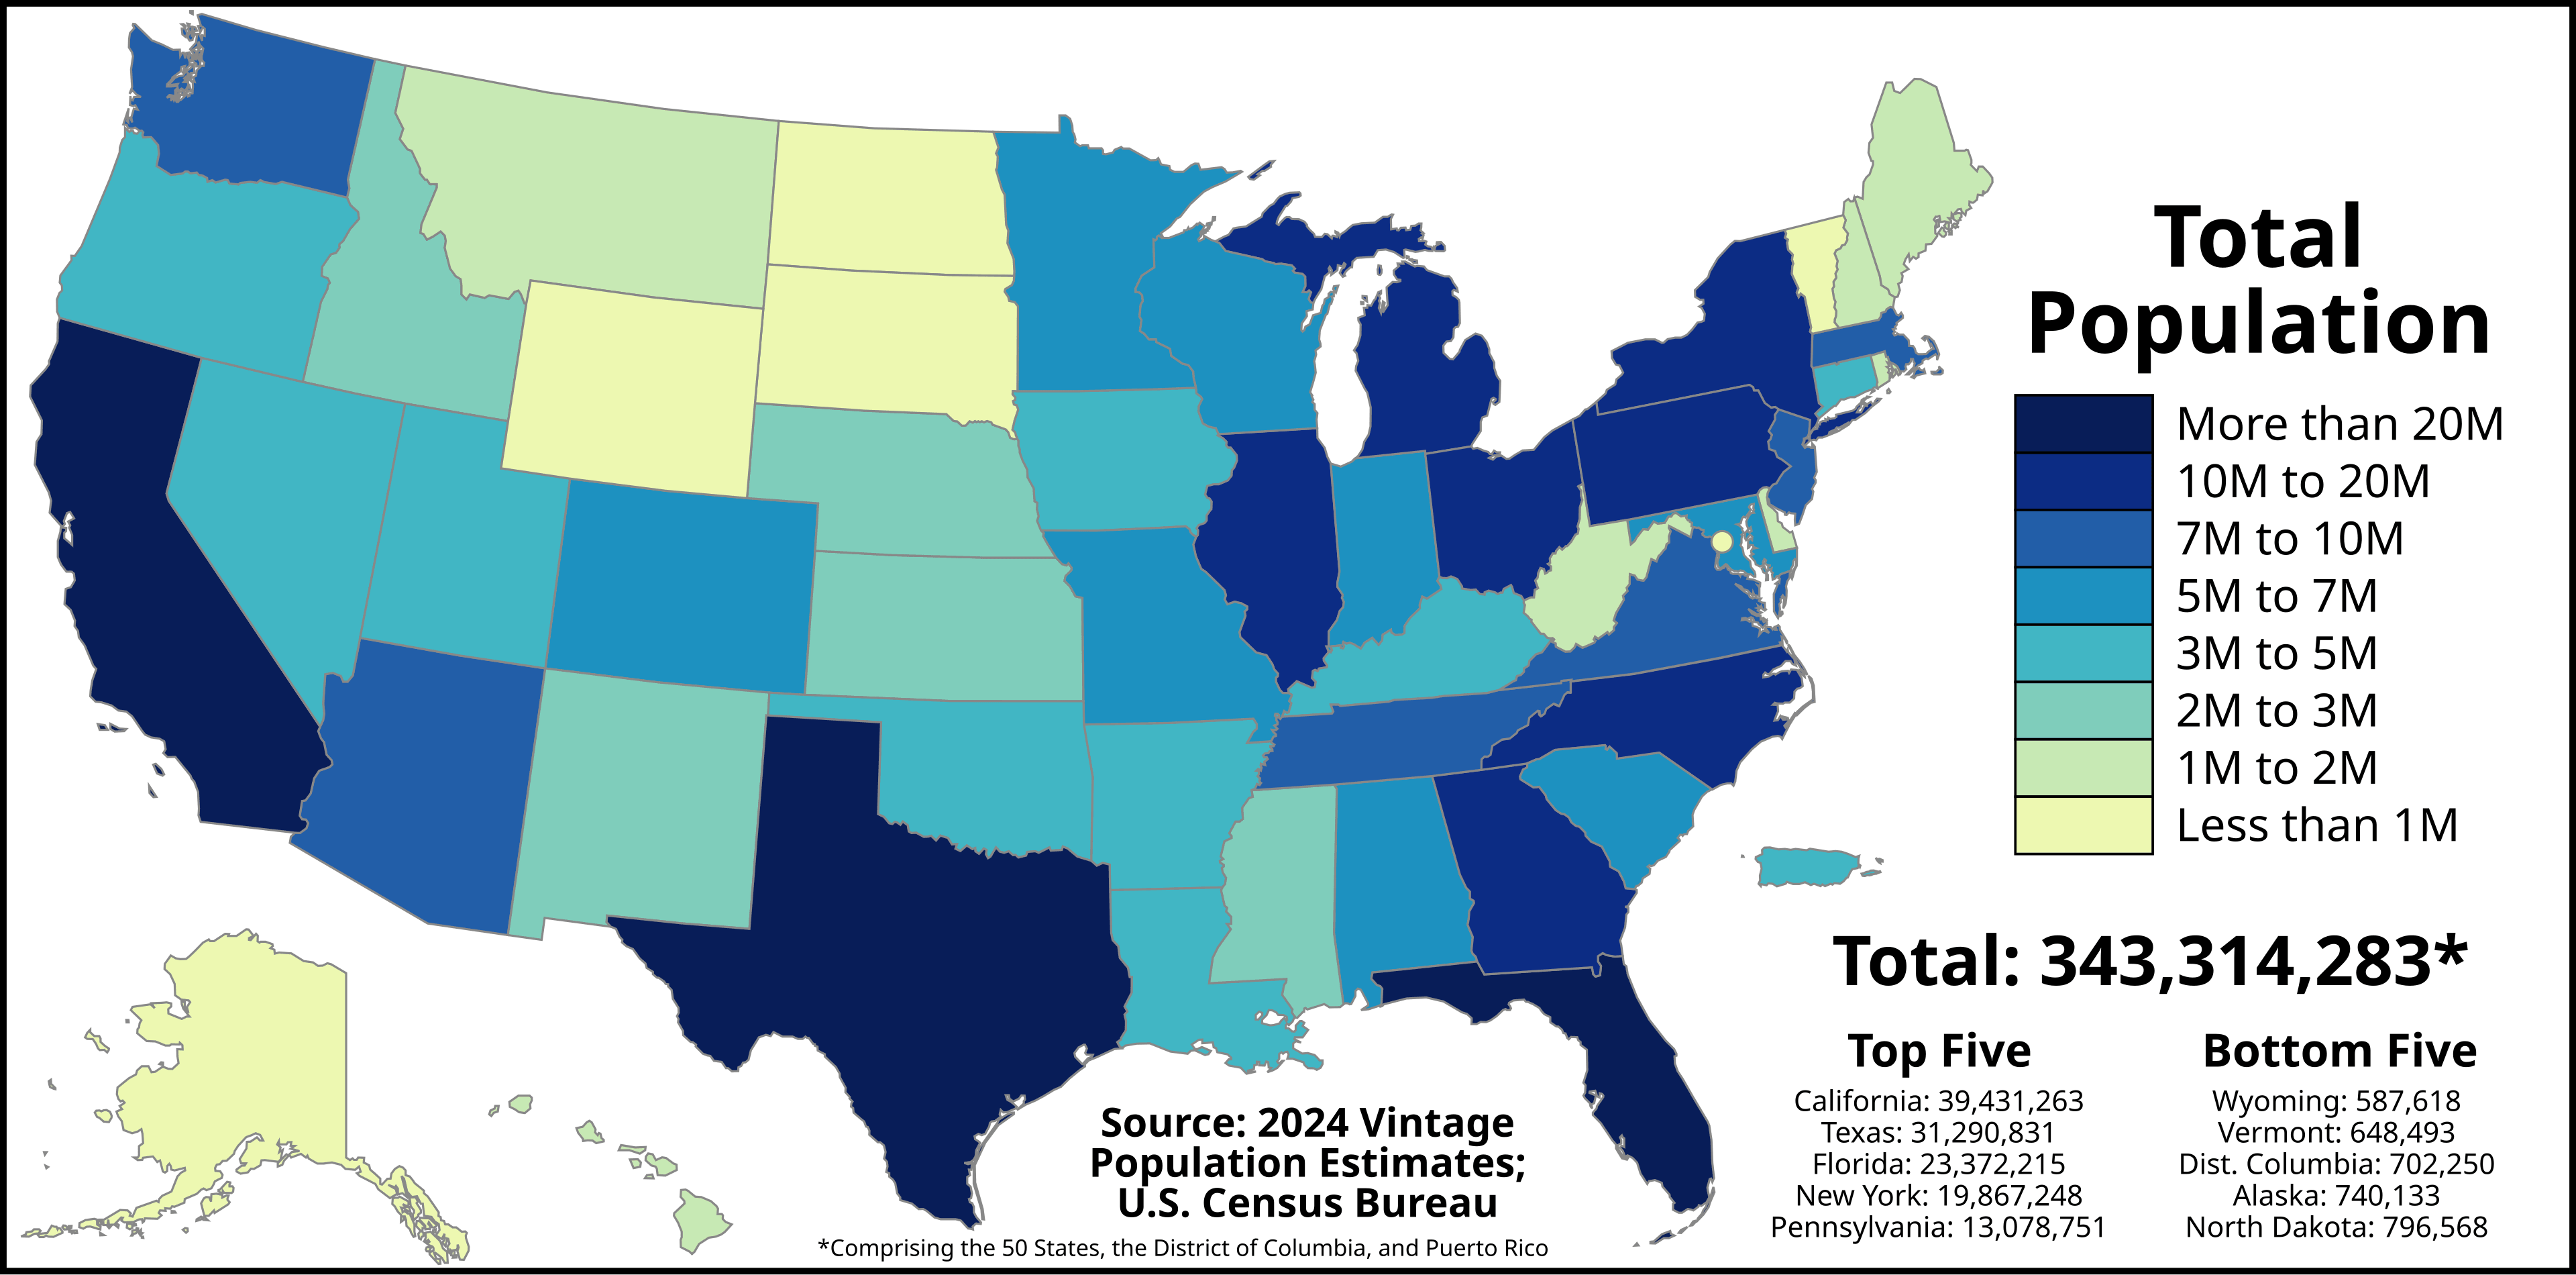
- California is the most populous U.S. state in 2025 with approximately 39.4 million people.
- Texas follows as the second largest state by population with 31.7 million residents.
- Florida ranks third with a population of 23.5 million, showing strong growth in the South.
- New York holds the fourth position with 20.0 million people.
- Pennsylvania (13.1 million) and Illinois (12.7 million) remain key population centers in the Northeast and Midwest.
- Ohio has a population of 11.9 million, continuing its role as a major Midwestern state.
- Georgia (11.3 million) and North Carolina (11.2 million) highlight the rapid growth of southern states.
- Michigan rounds out the top 10 with 10.1 million residents.
- Overall, the data reflects a population shift toward the South and Sun Belt regions.
Population Growth In The United States between 1790 and 2024
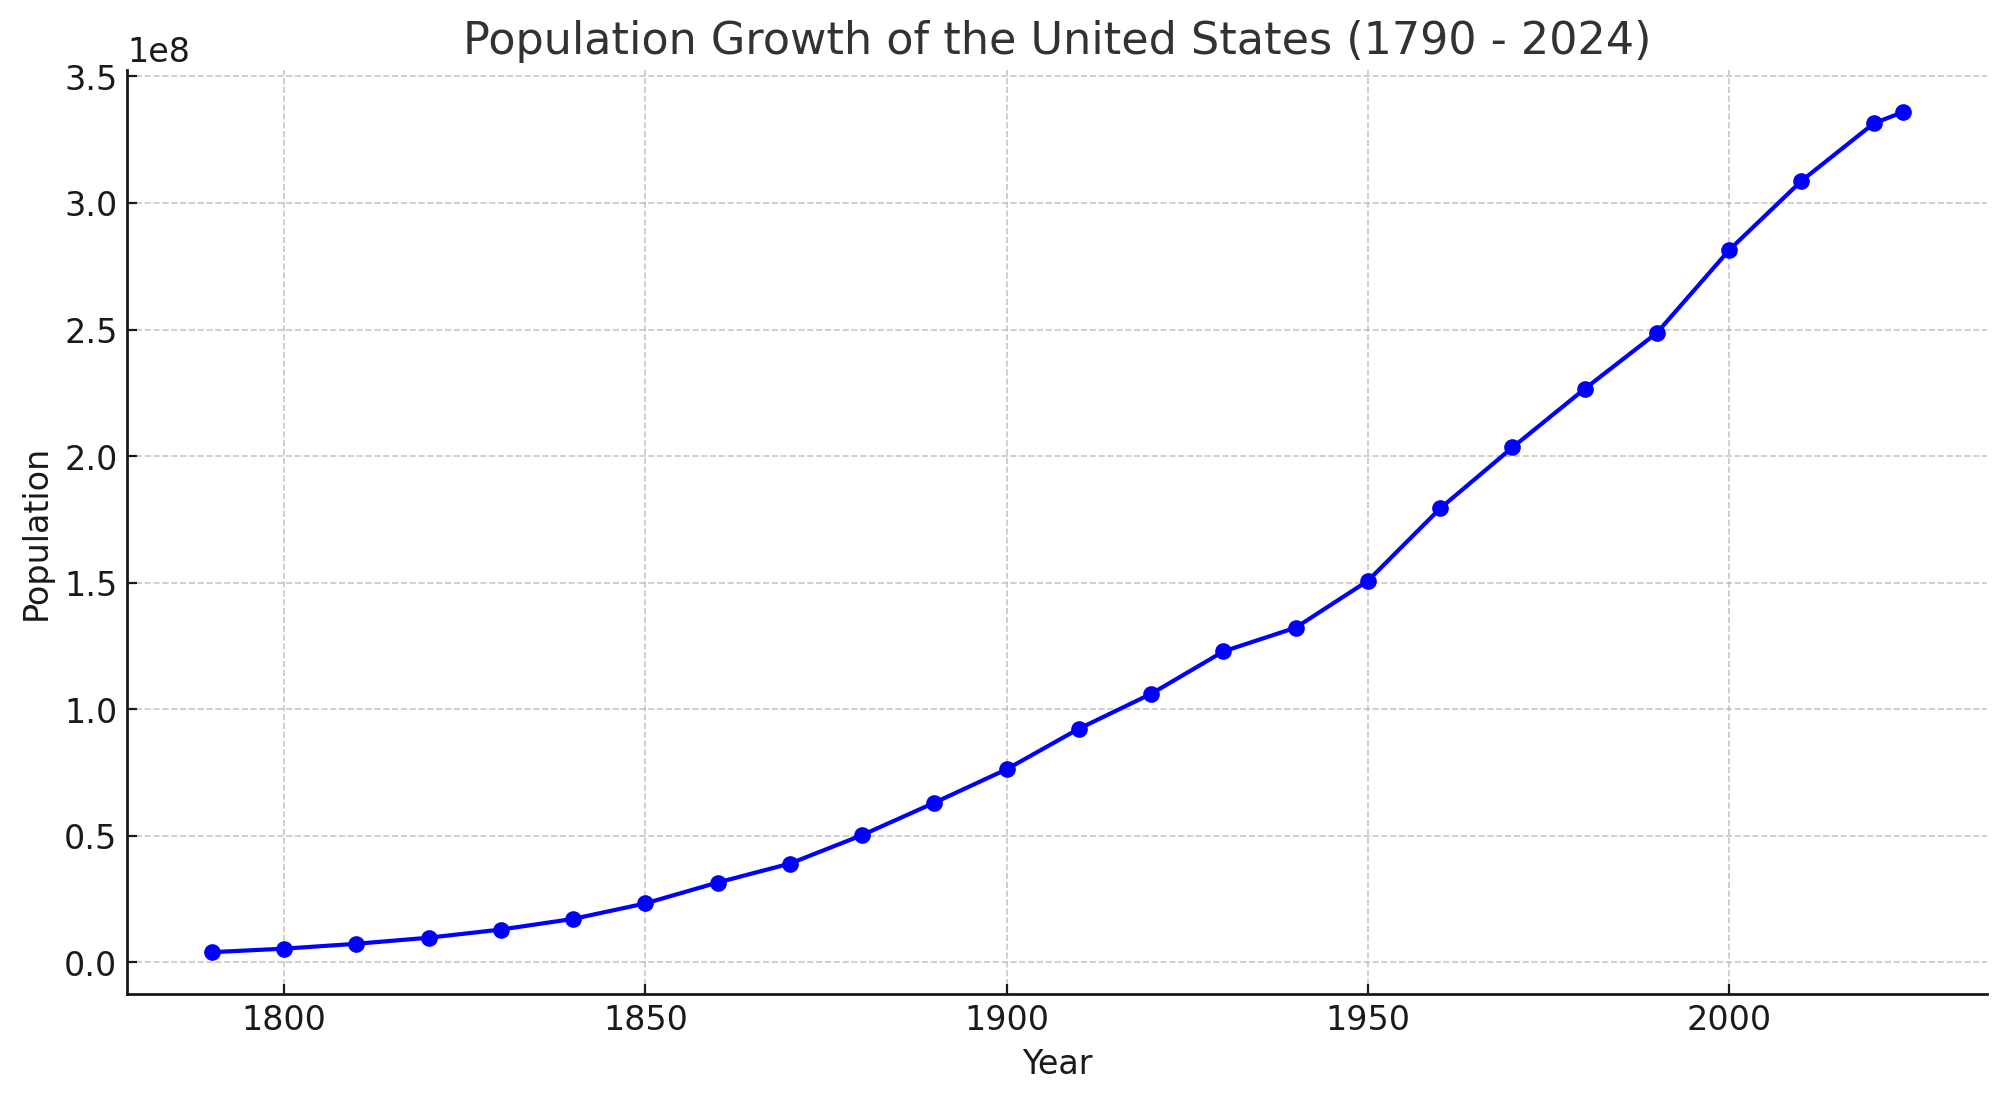 This line chart showing the population growth of the United States from 1790 to an estimated value for 2024. The chart highlights the significant increase in population over time, especially through periods of rapid growth in the 19th and 20th centuries, with continued growth into the 21st century.
United States ethnic demographic composition
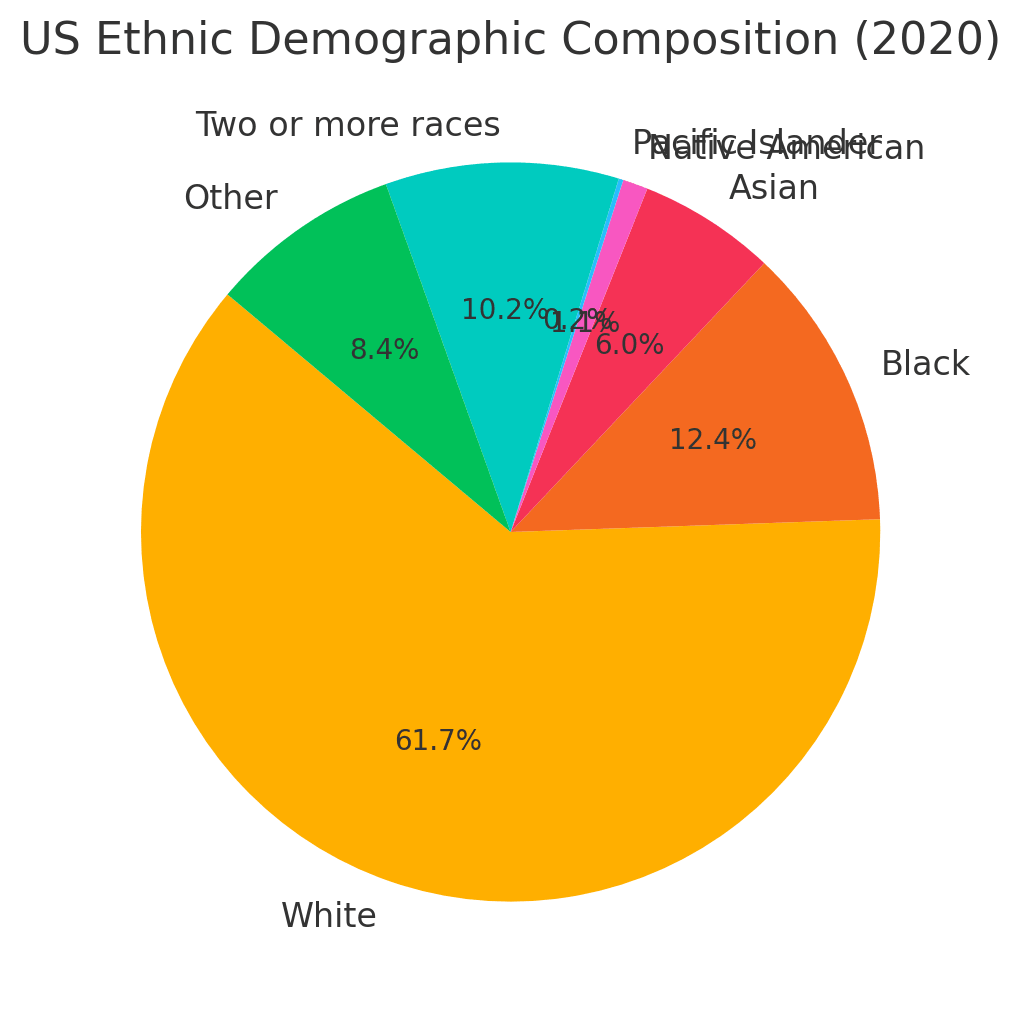
This pie chart showing the ethnic demographic composition of the United States based on 2020 data. This chart provides a visual breakdown of different ethnic groups, showing that white Americans make up the largest percentage, followed by black, Asian and other groups. The diverse racial composition reflects the multicultural nature of the US.
Religious composition of the USA in 2023
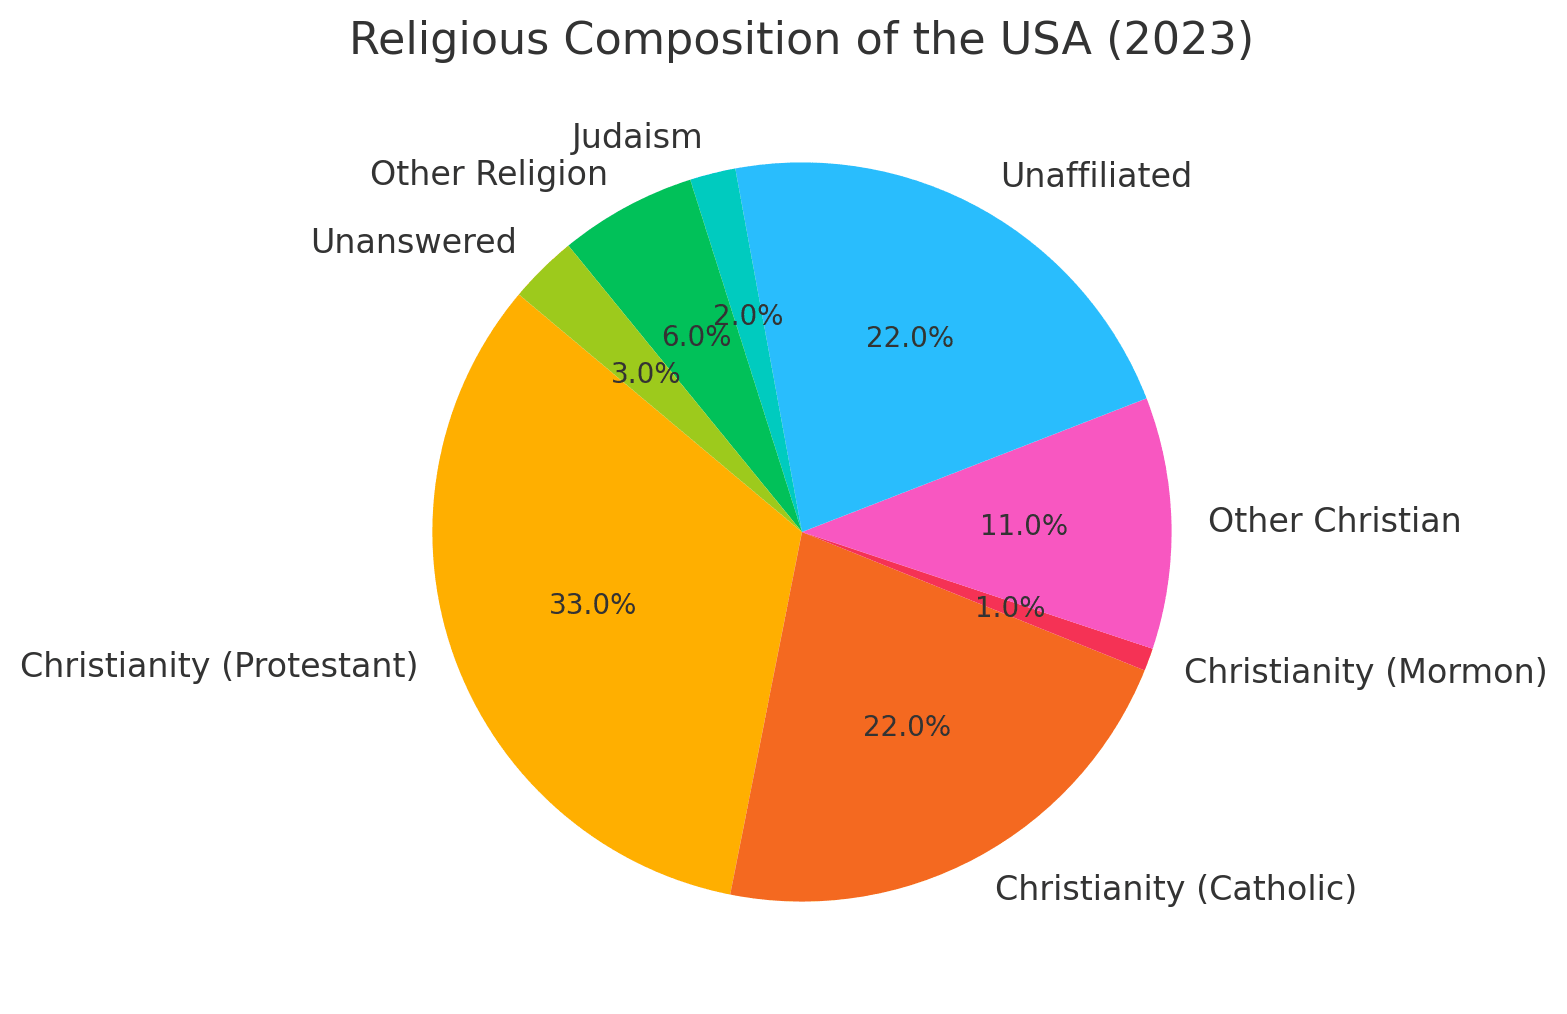
This is a pie chart illustrating the religious composition of the United States in 2023. The largest category is Christianity, divided into Protestantism, Catholicism, Mormonism and other Christian affiliations. The unaffiliated group represents 22% of the population, reflecting the growing trend of people not identifying with a particular religion. Other religions and those who left the question unanswered make up the remaining segments, contributing to the overall diversity of religious beliefs in the US.
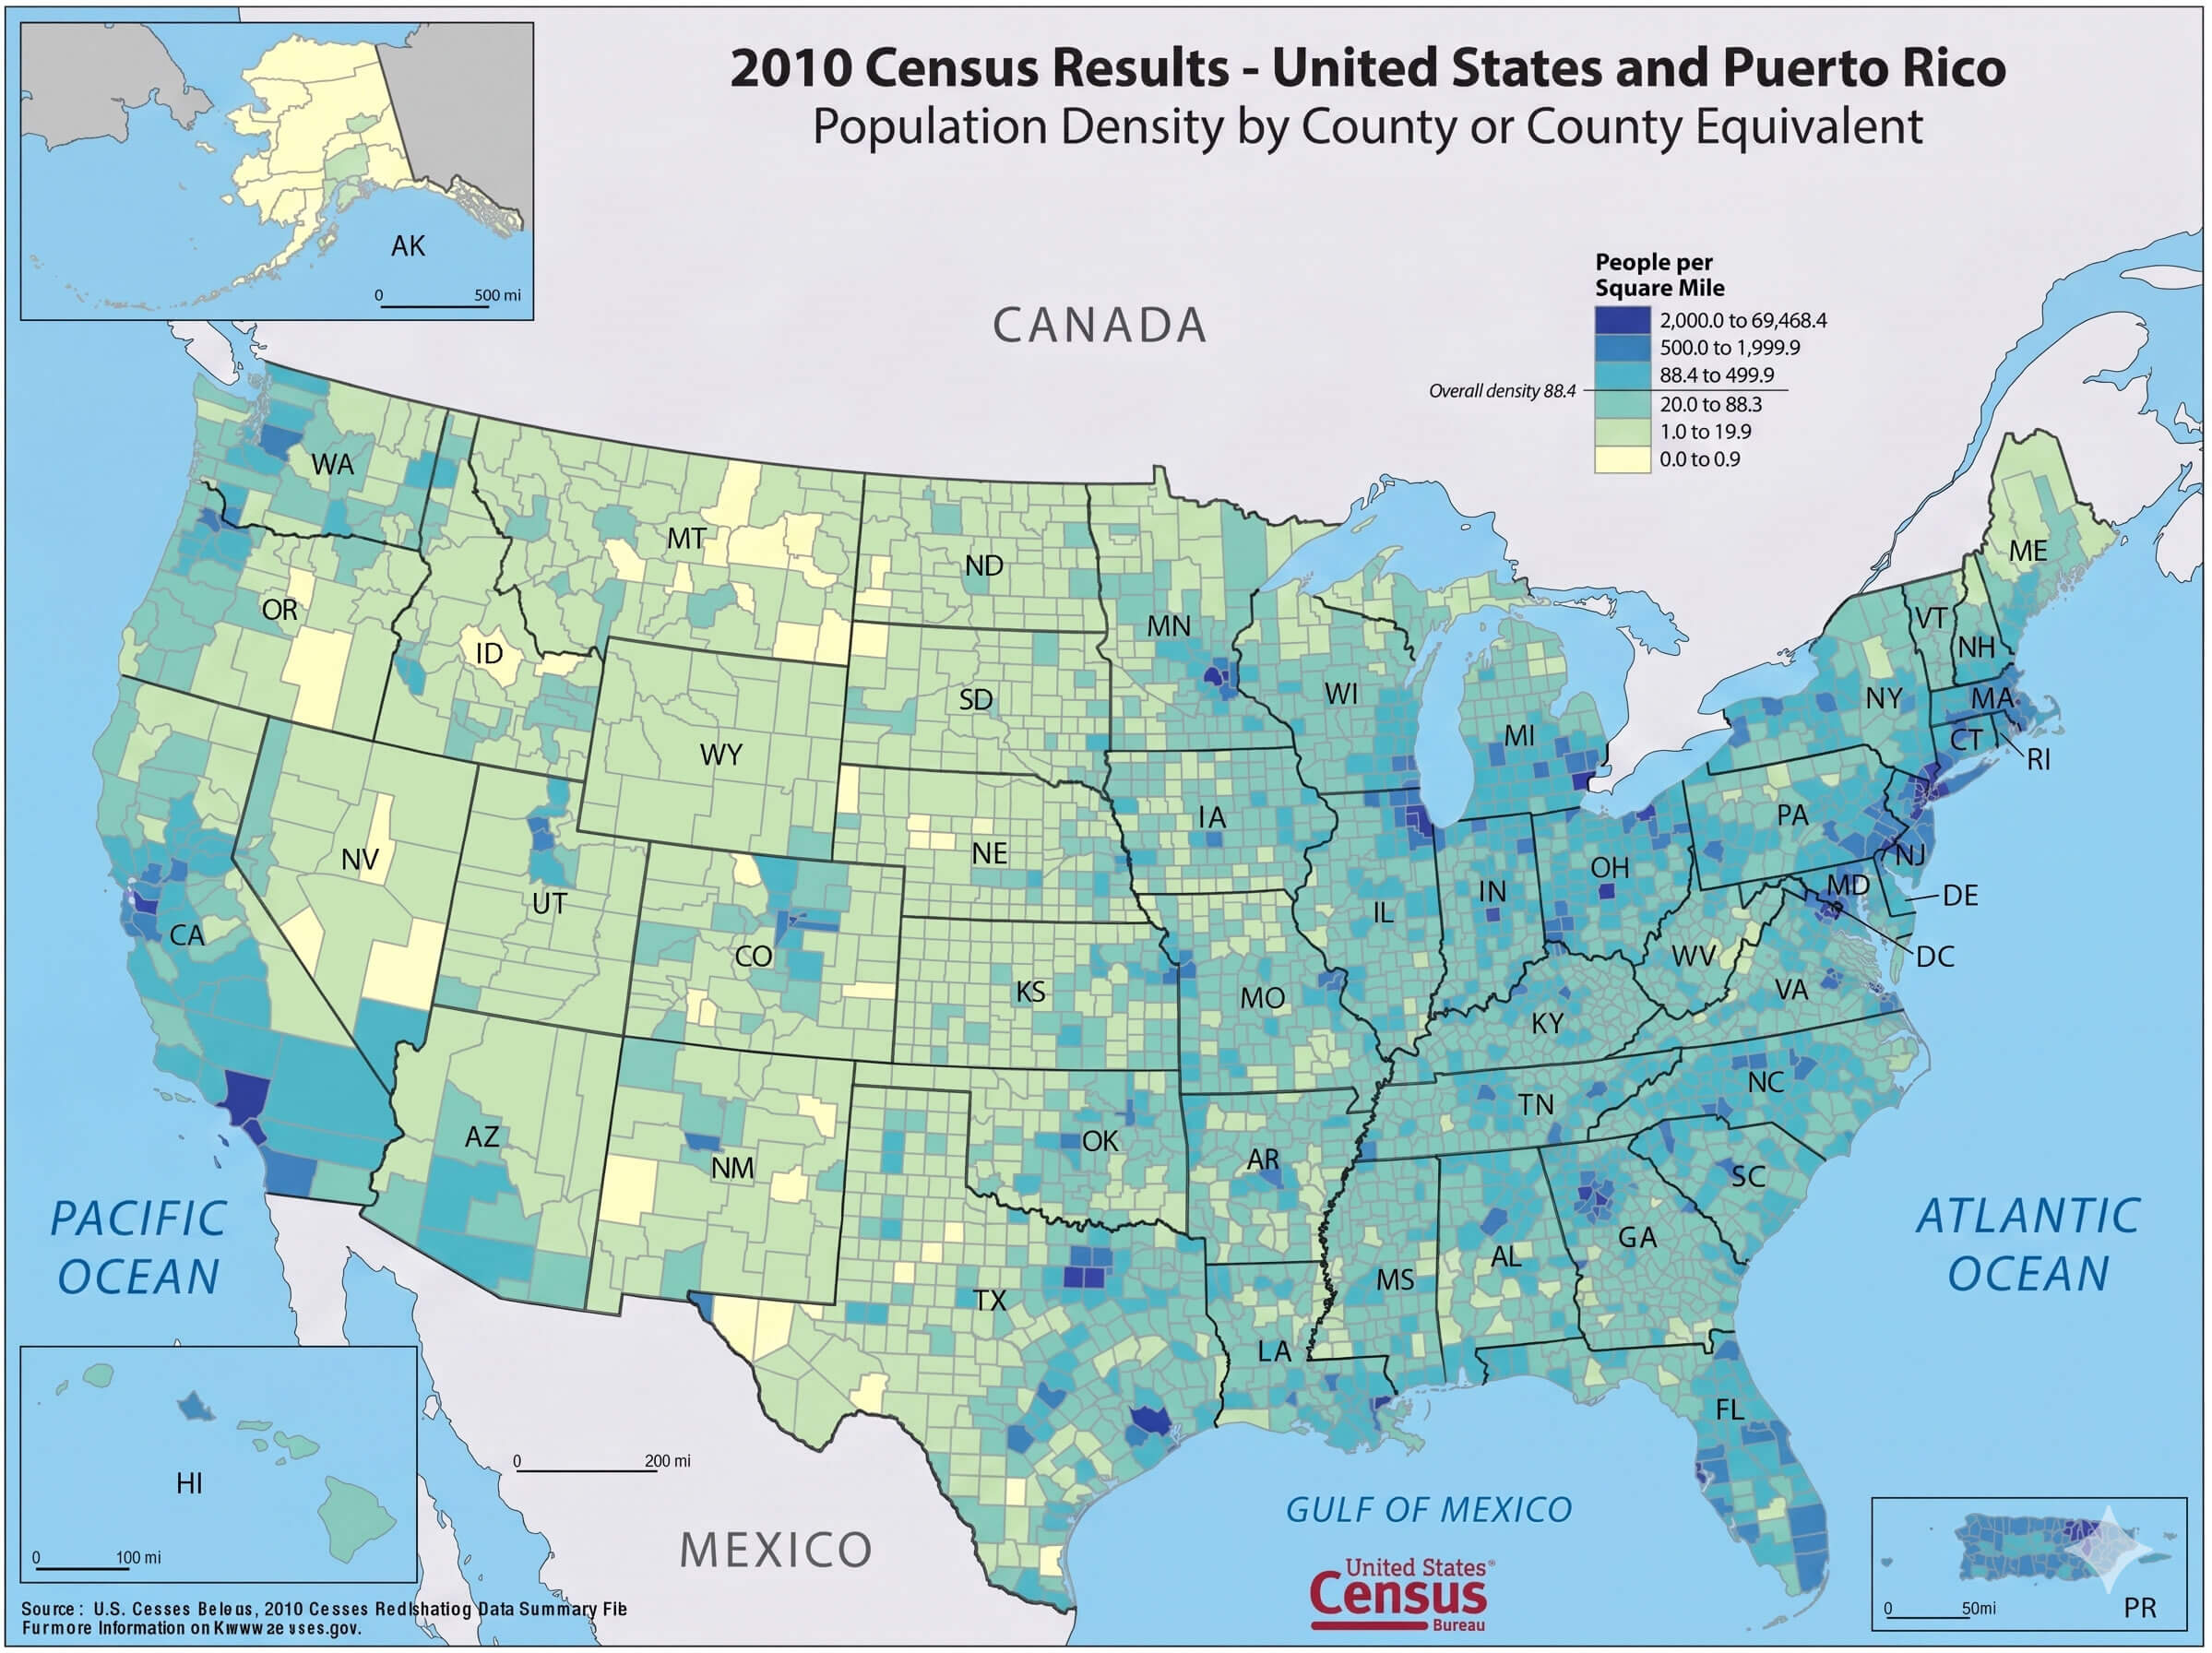
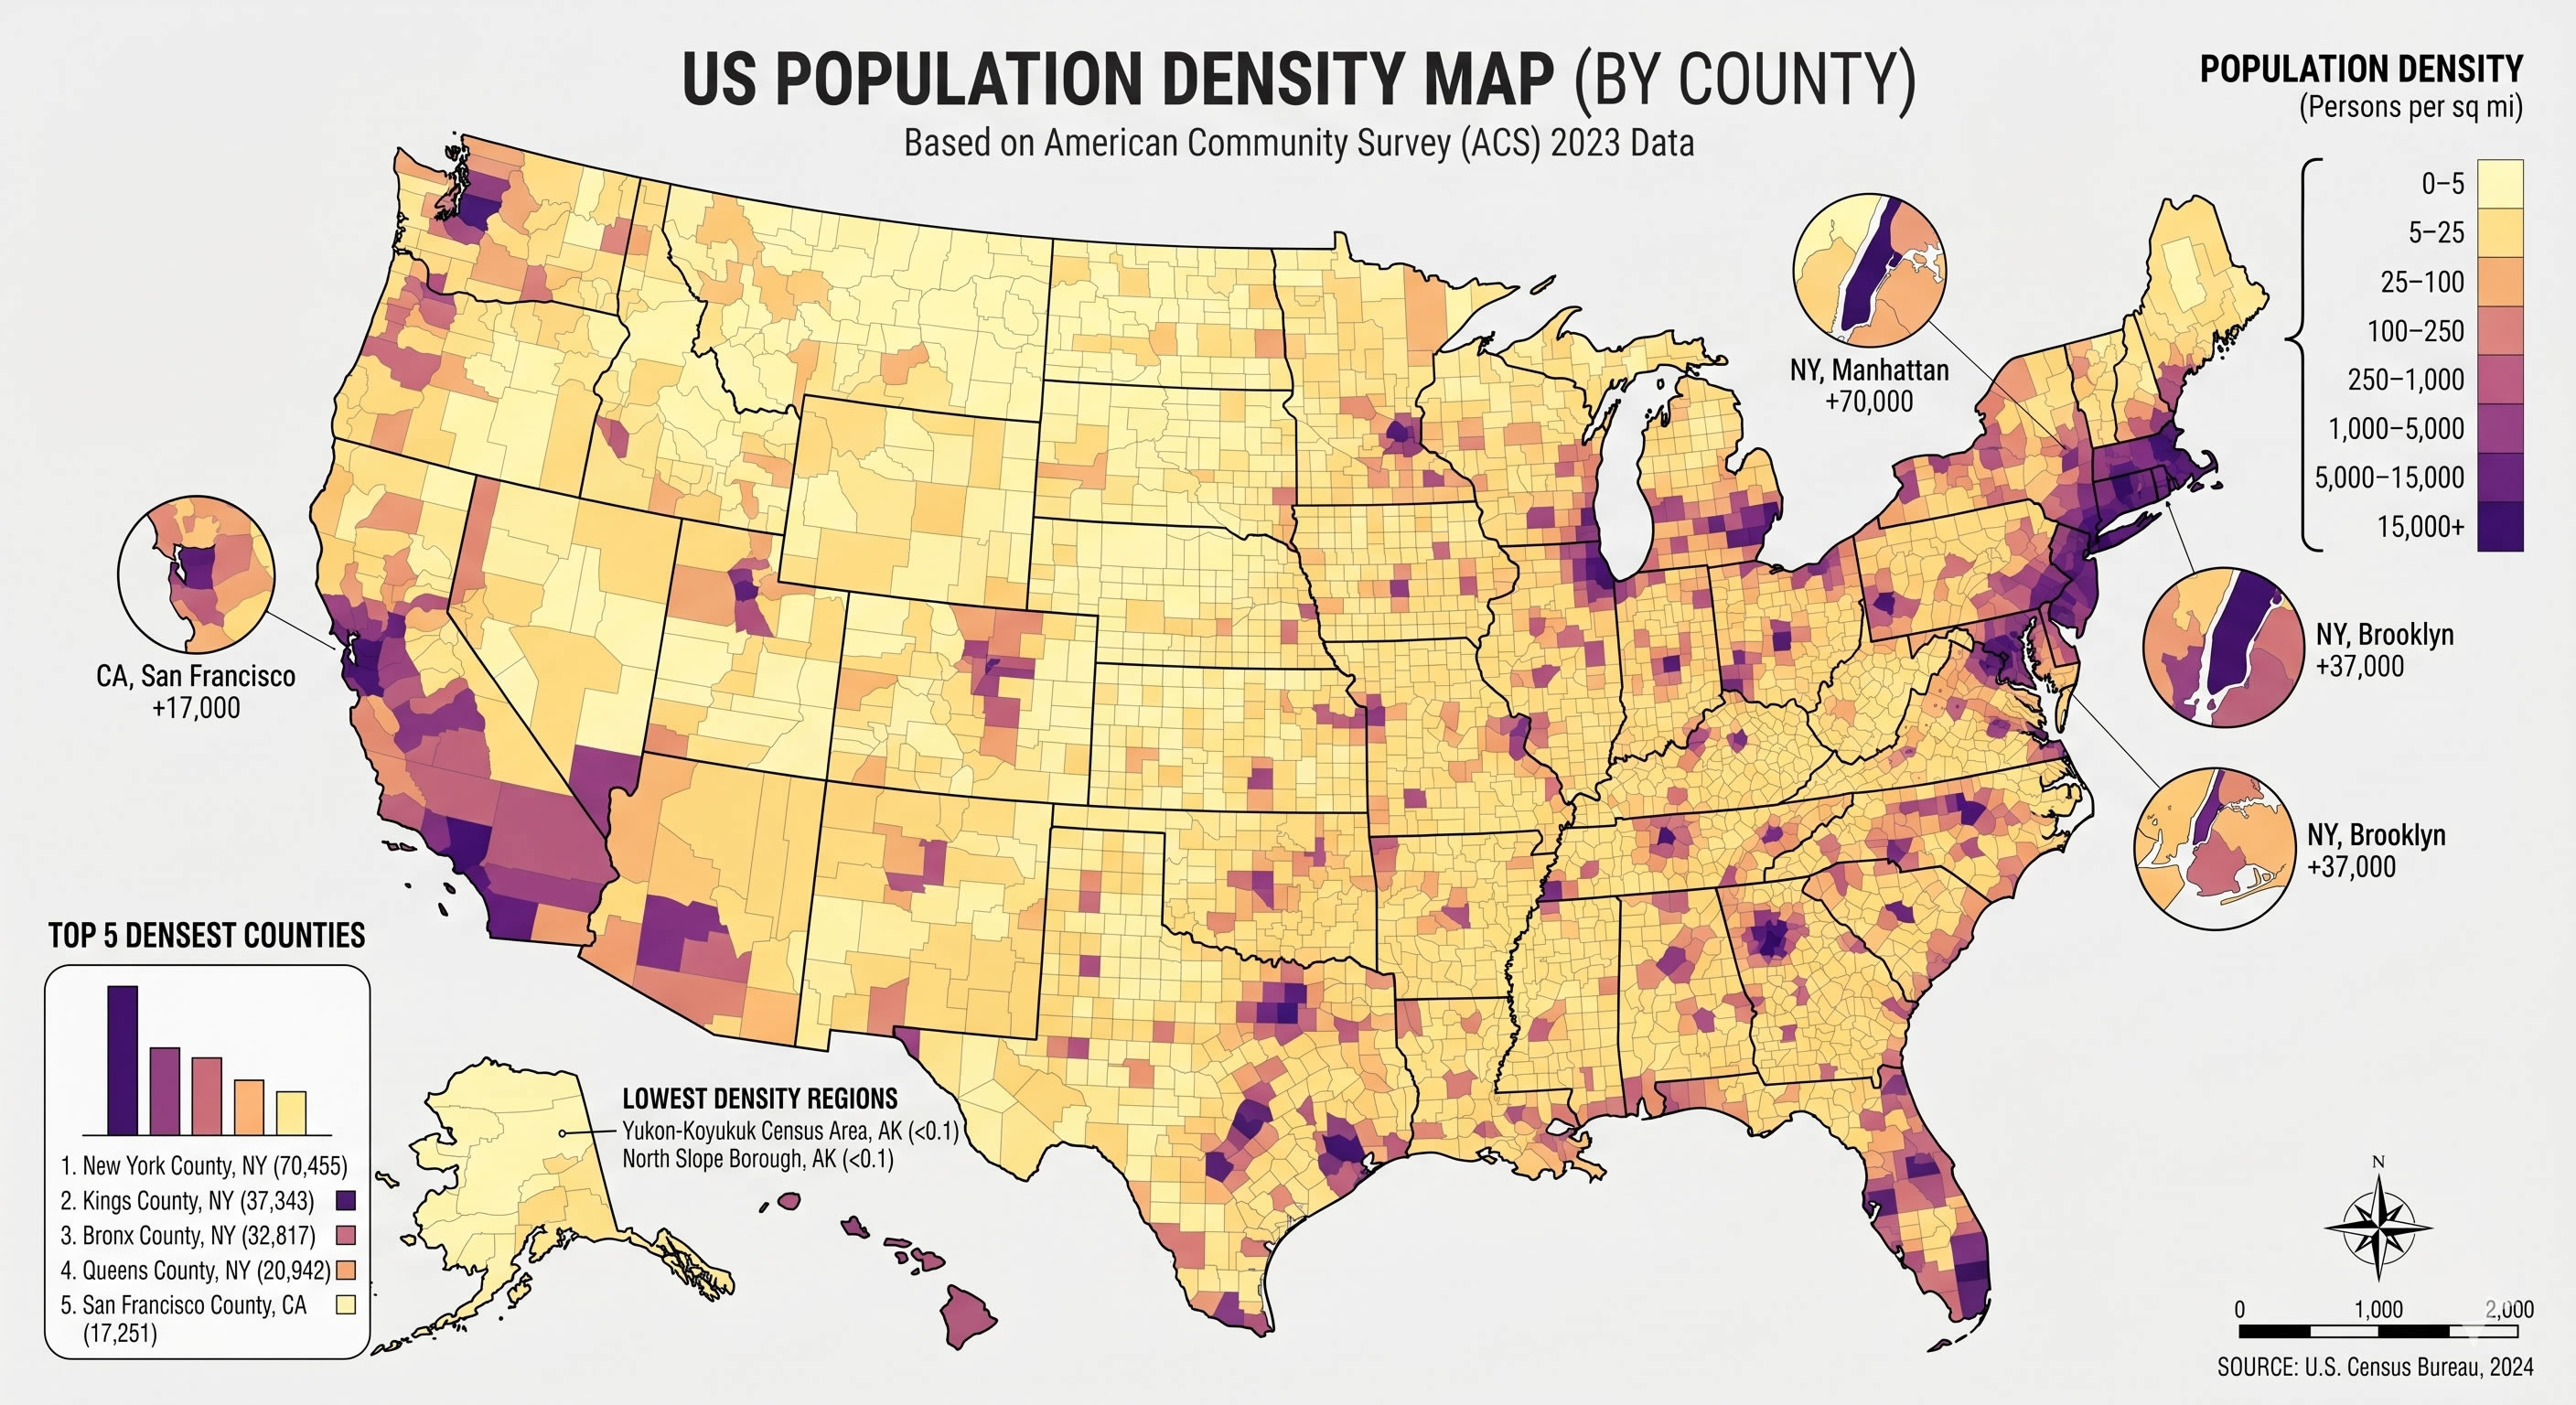
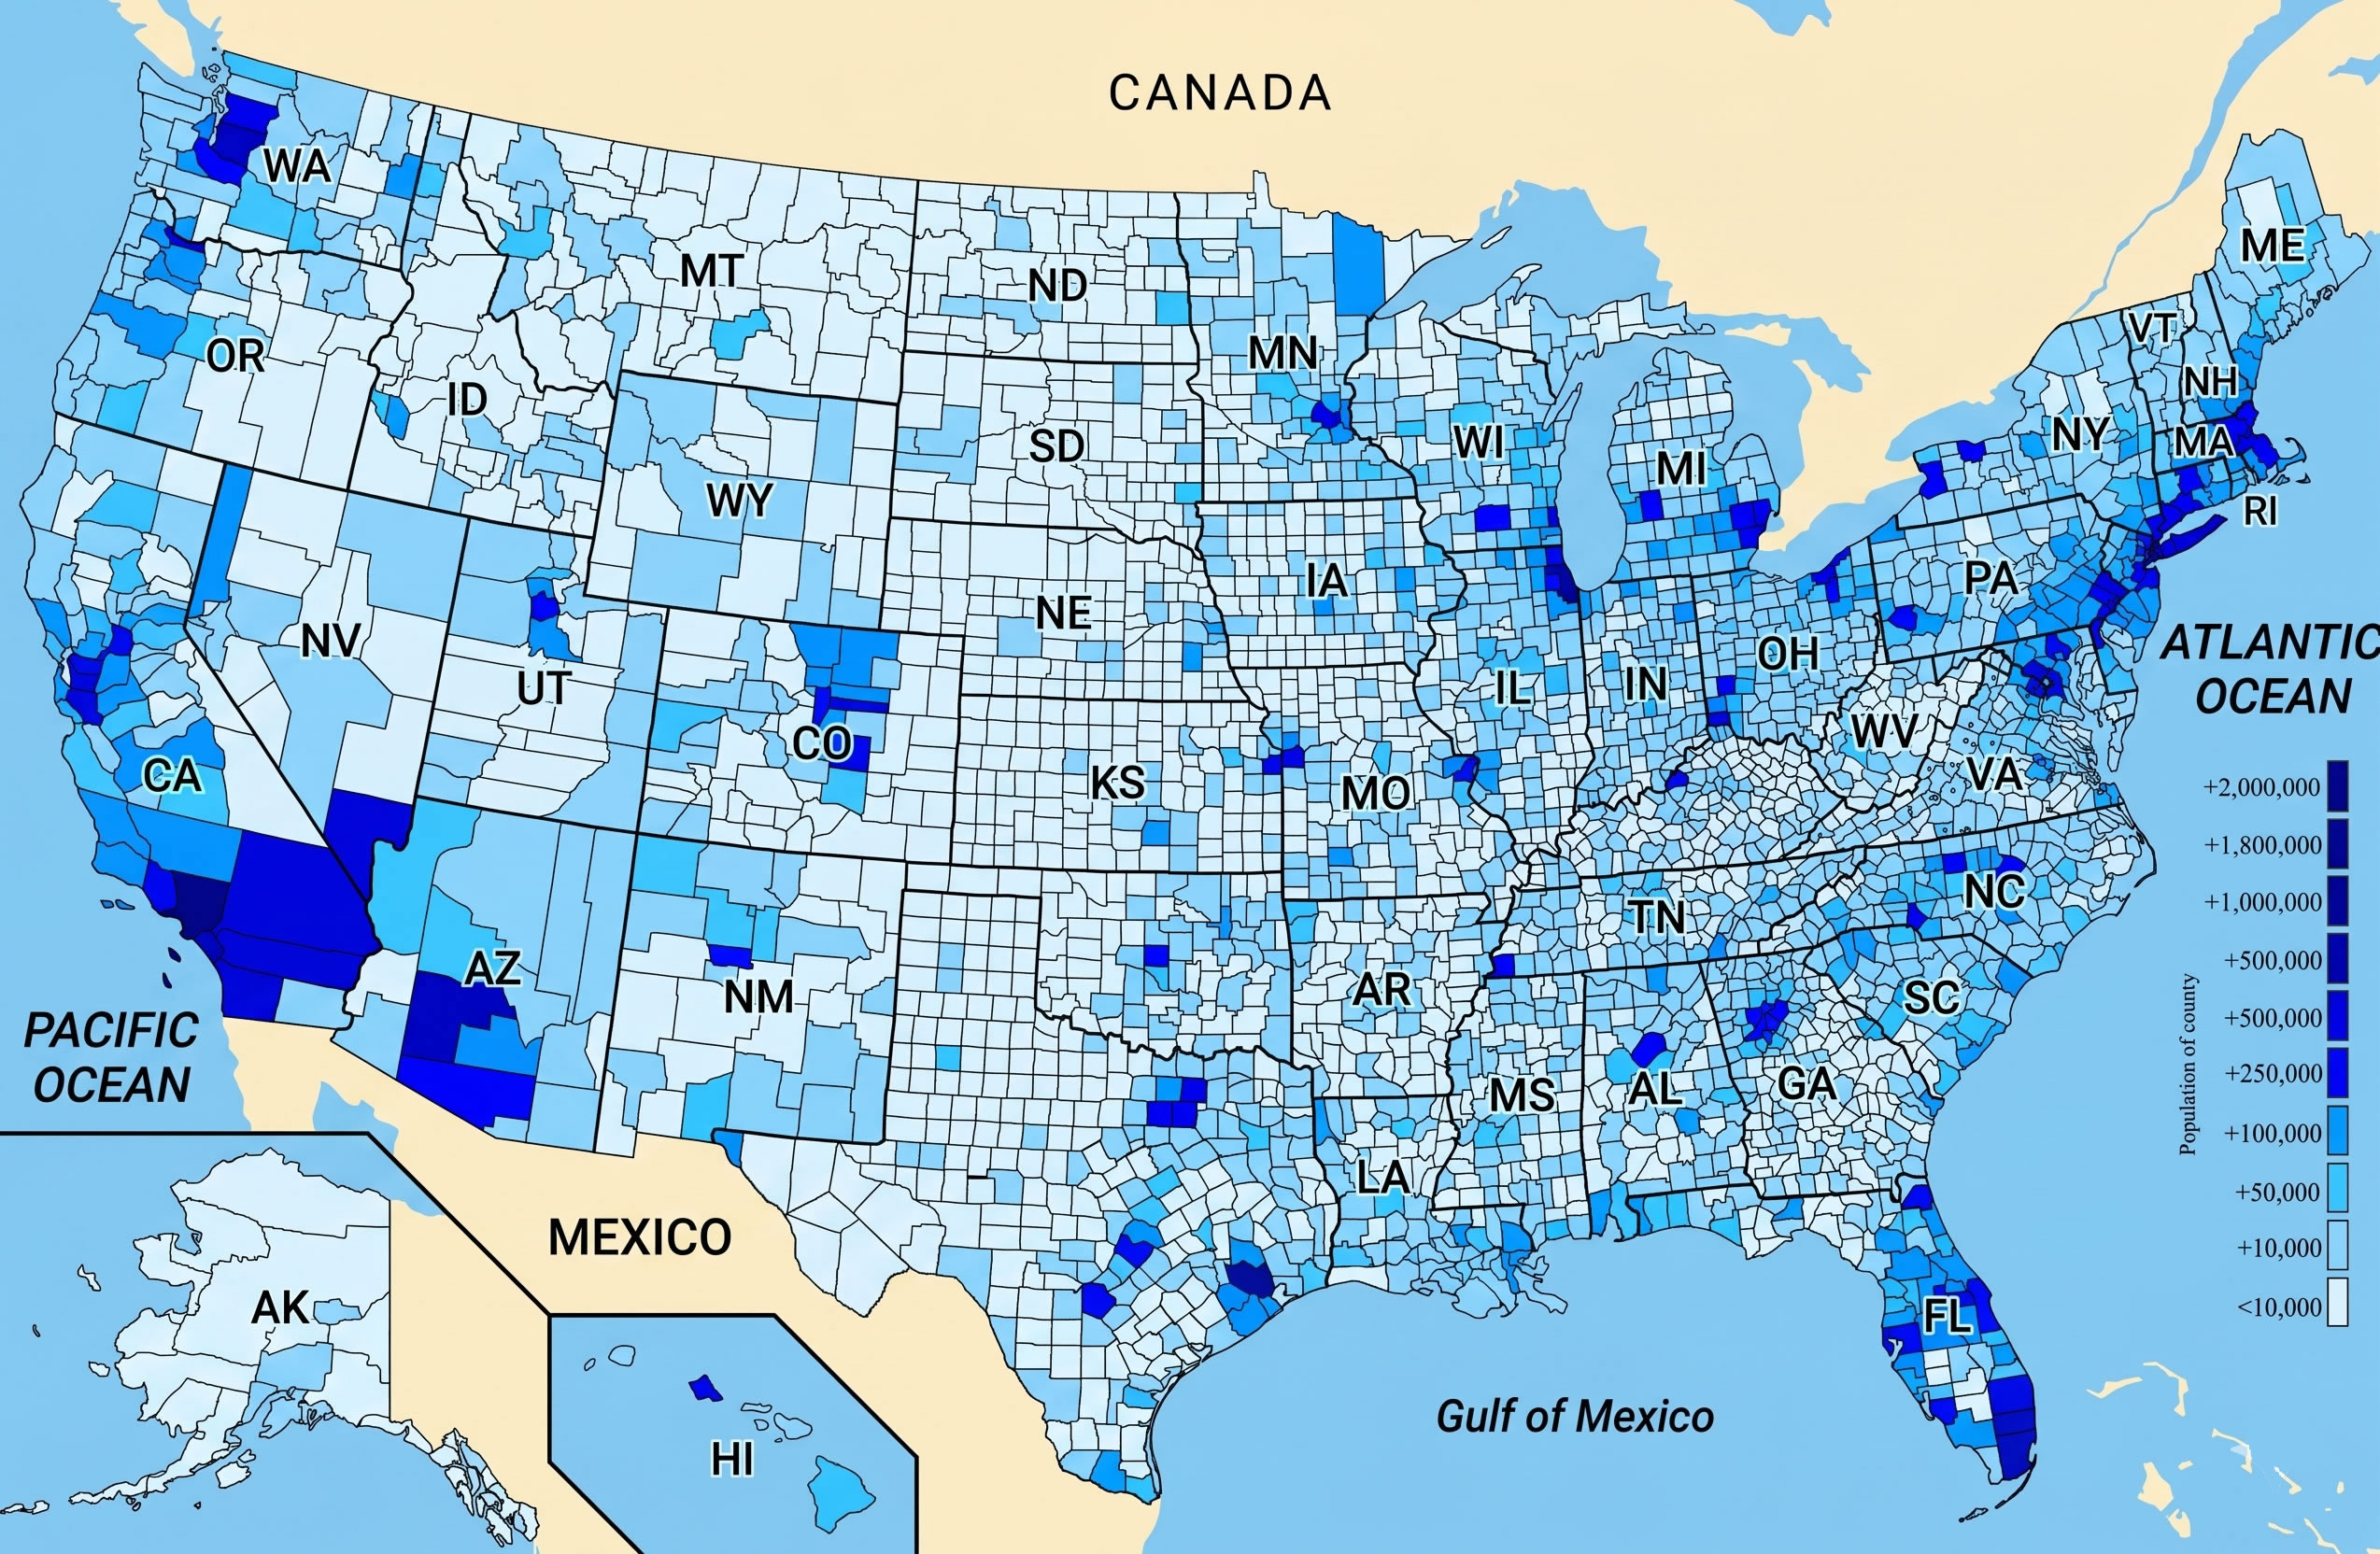
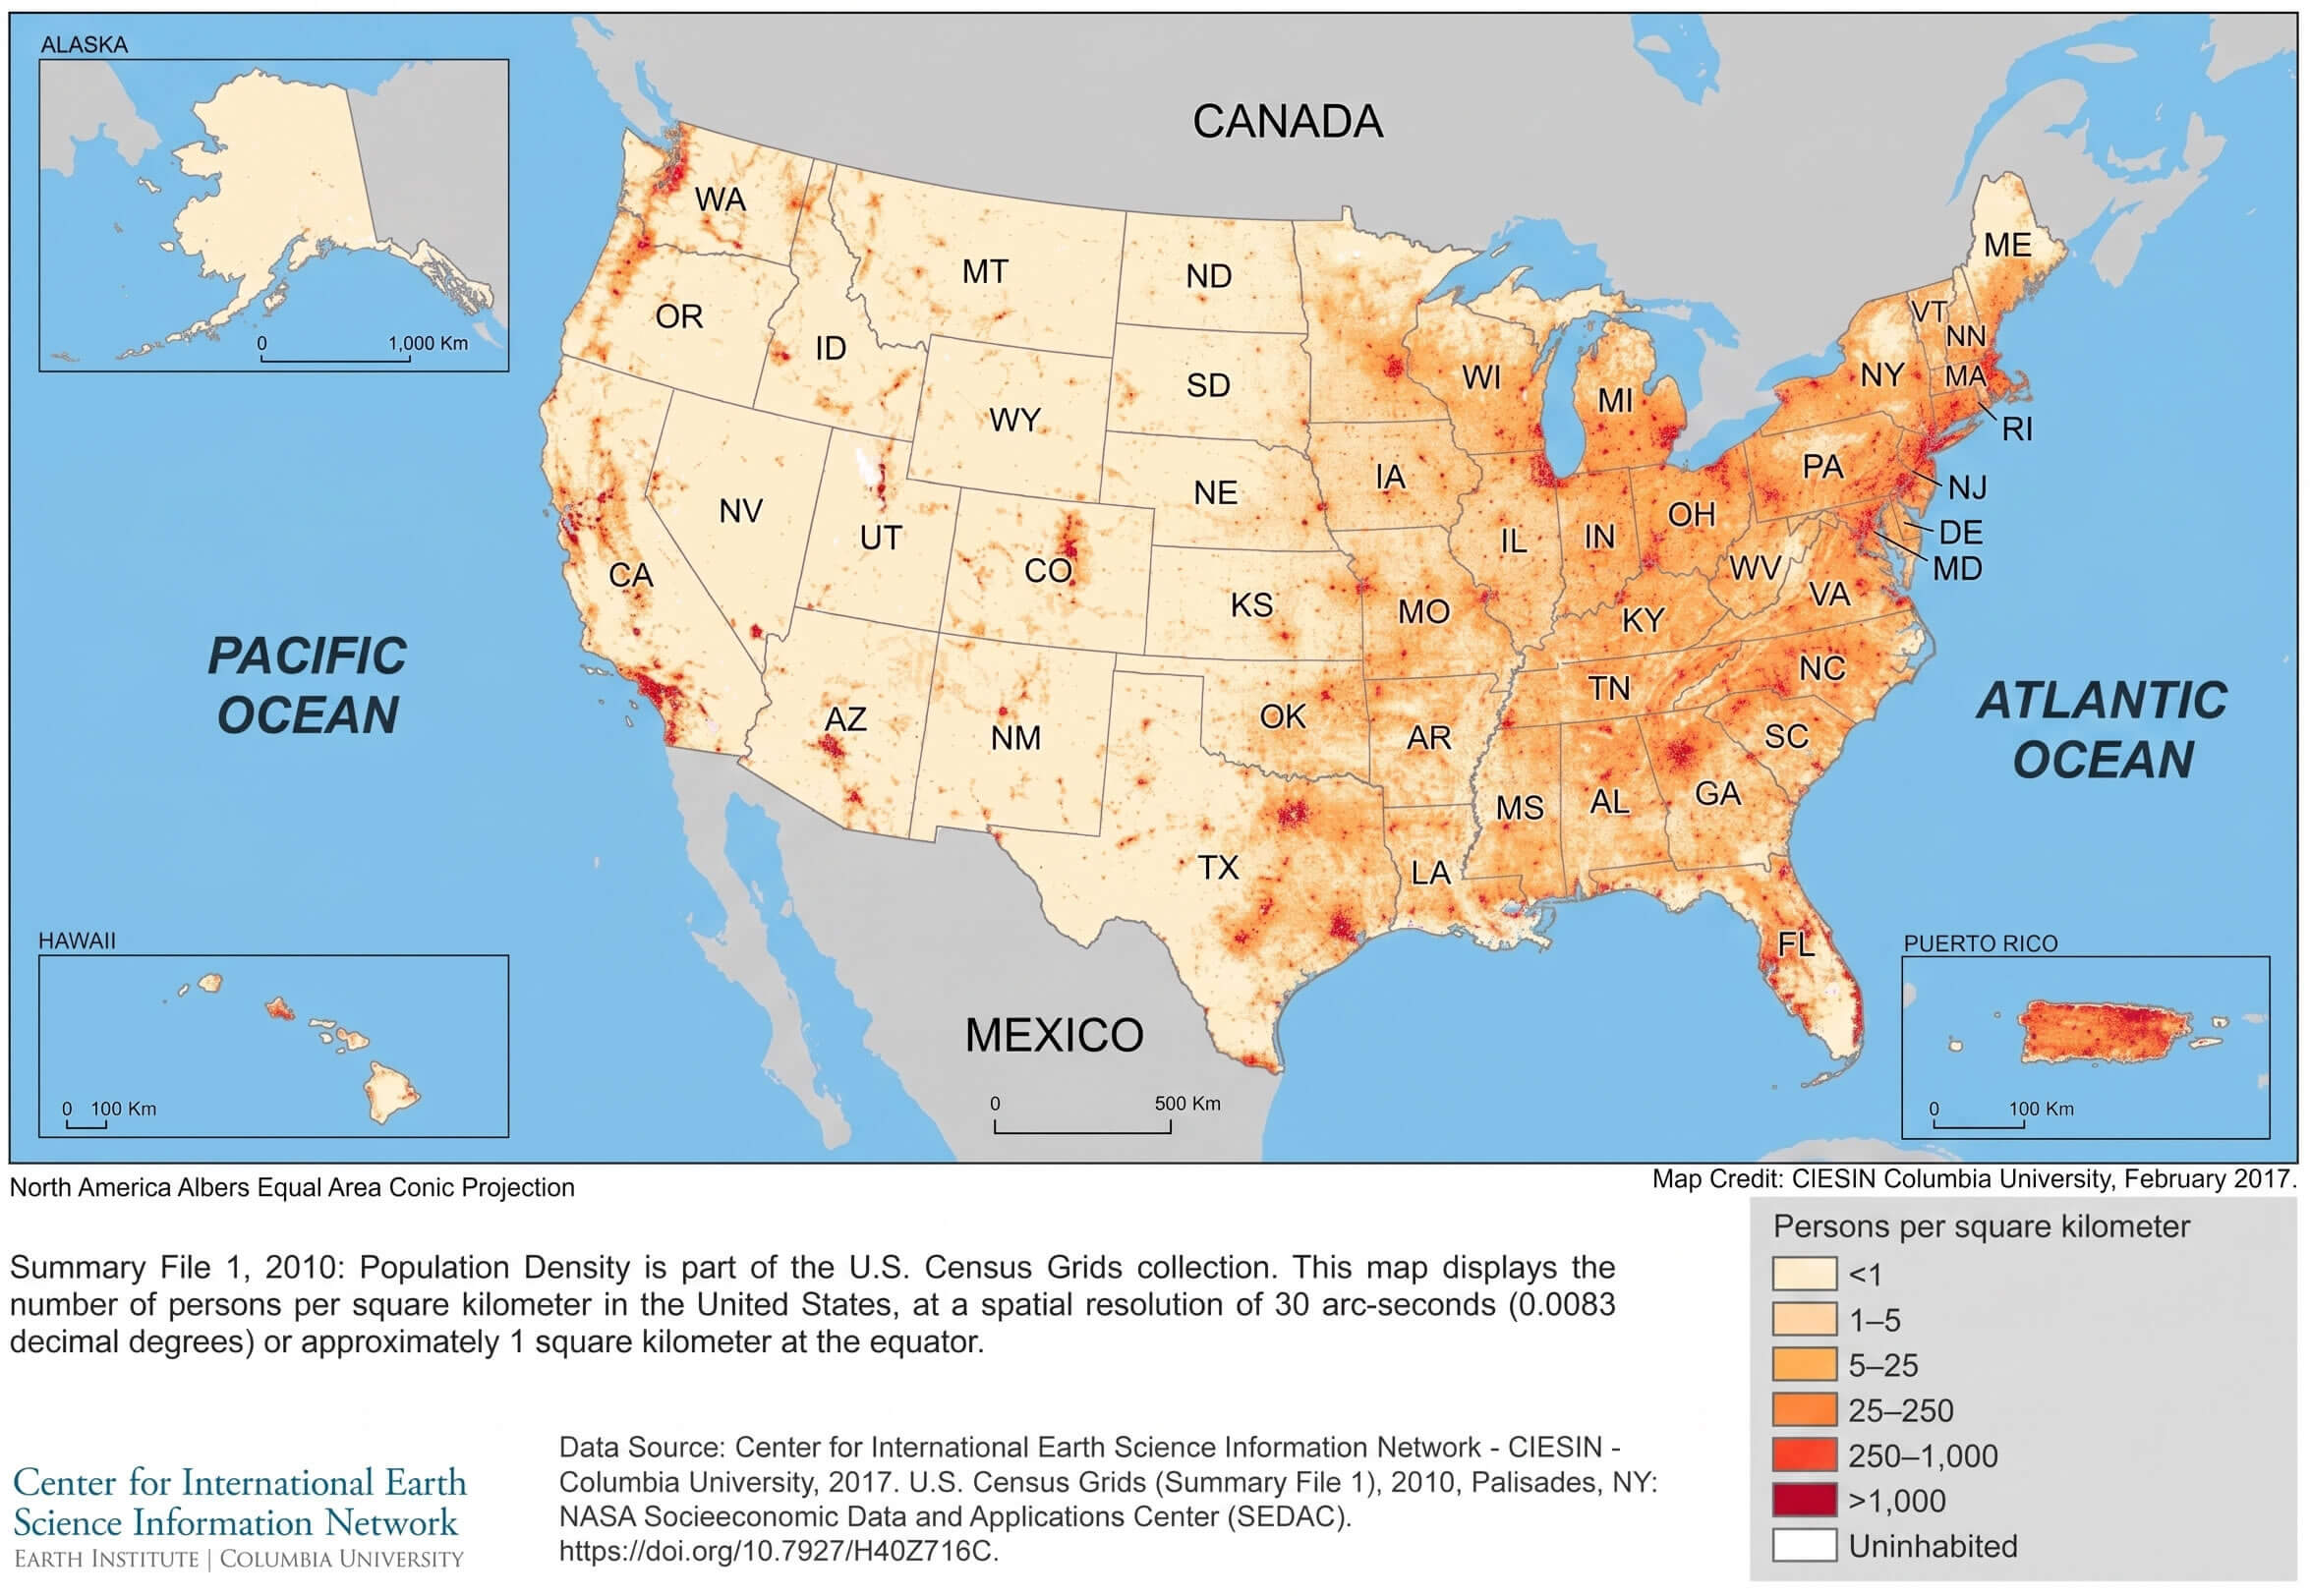
US population density by county 2010 census map
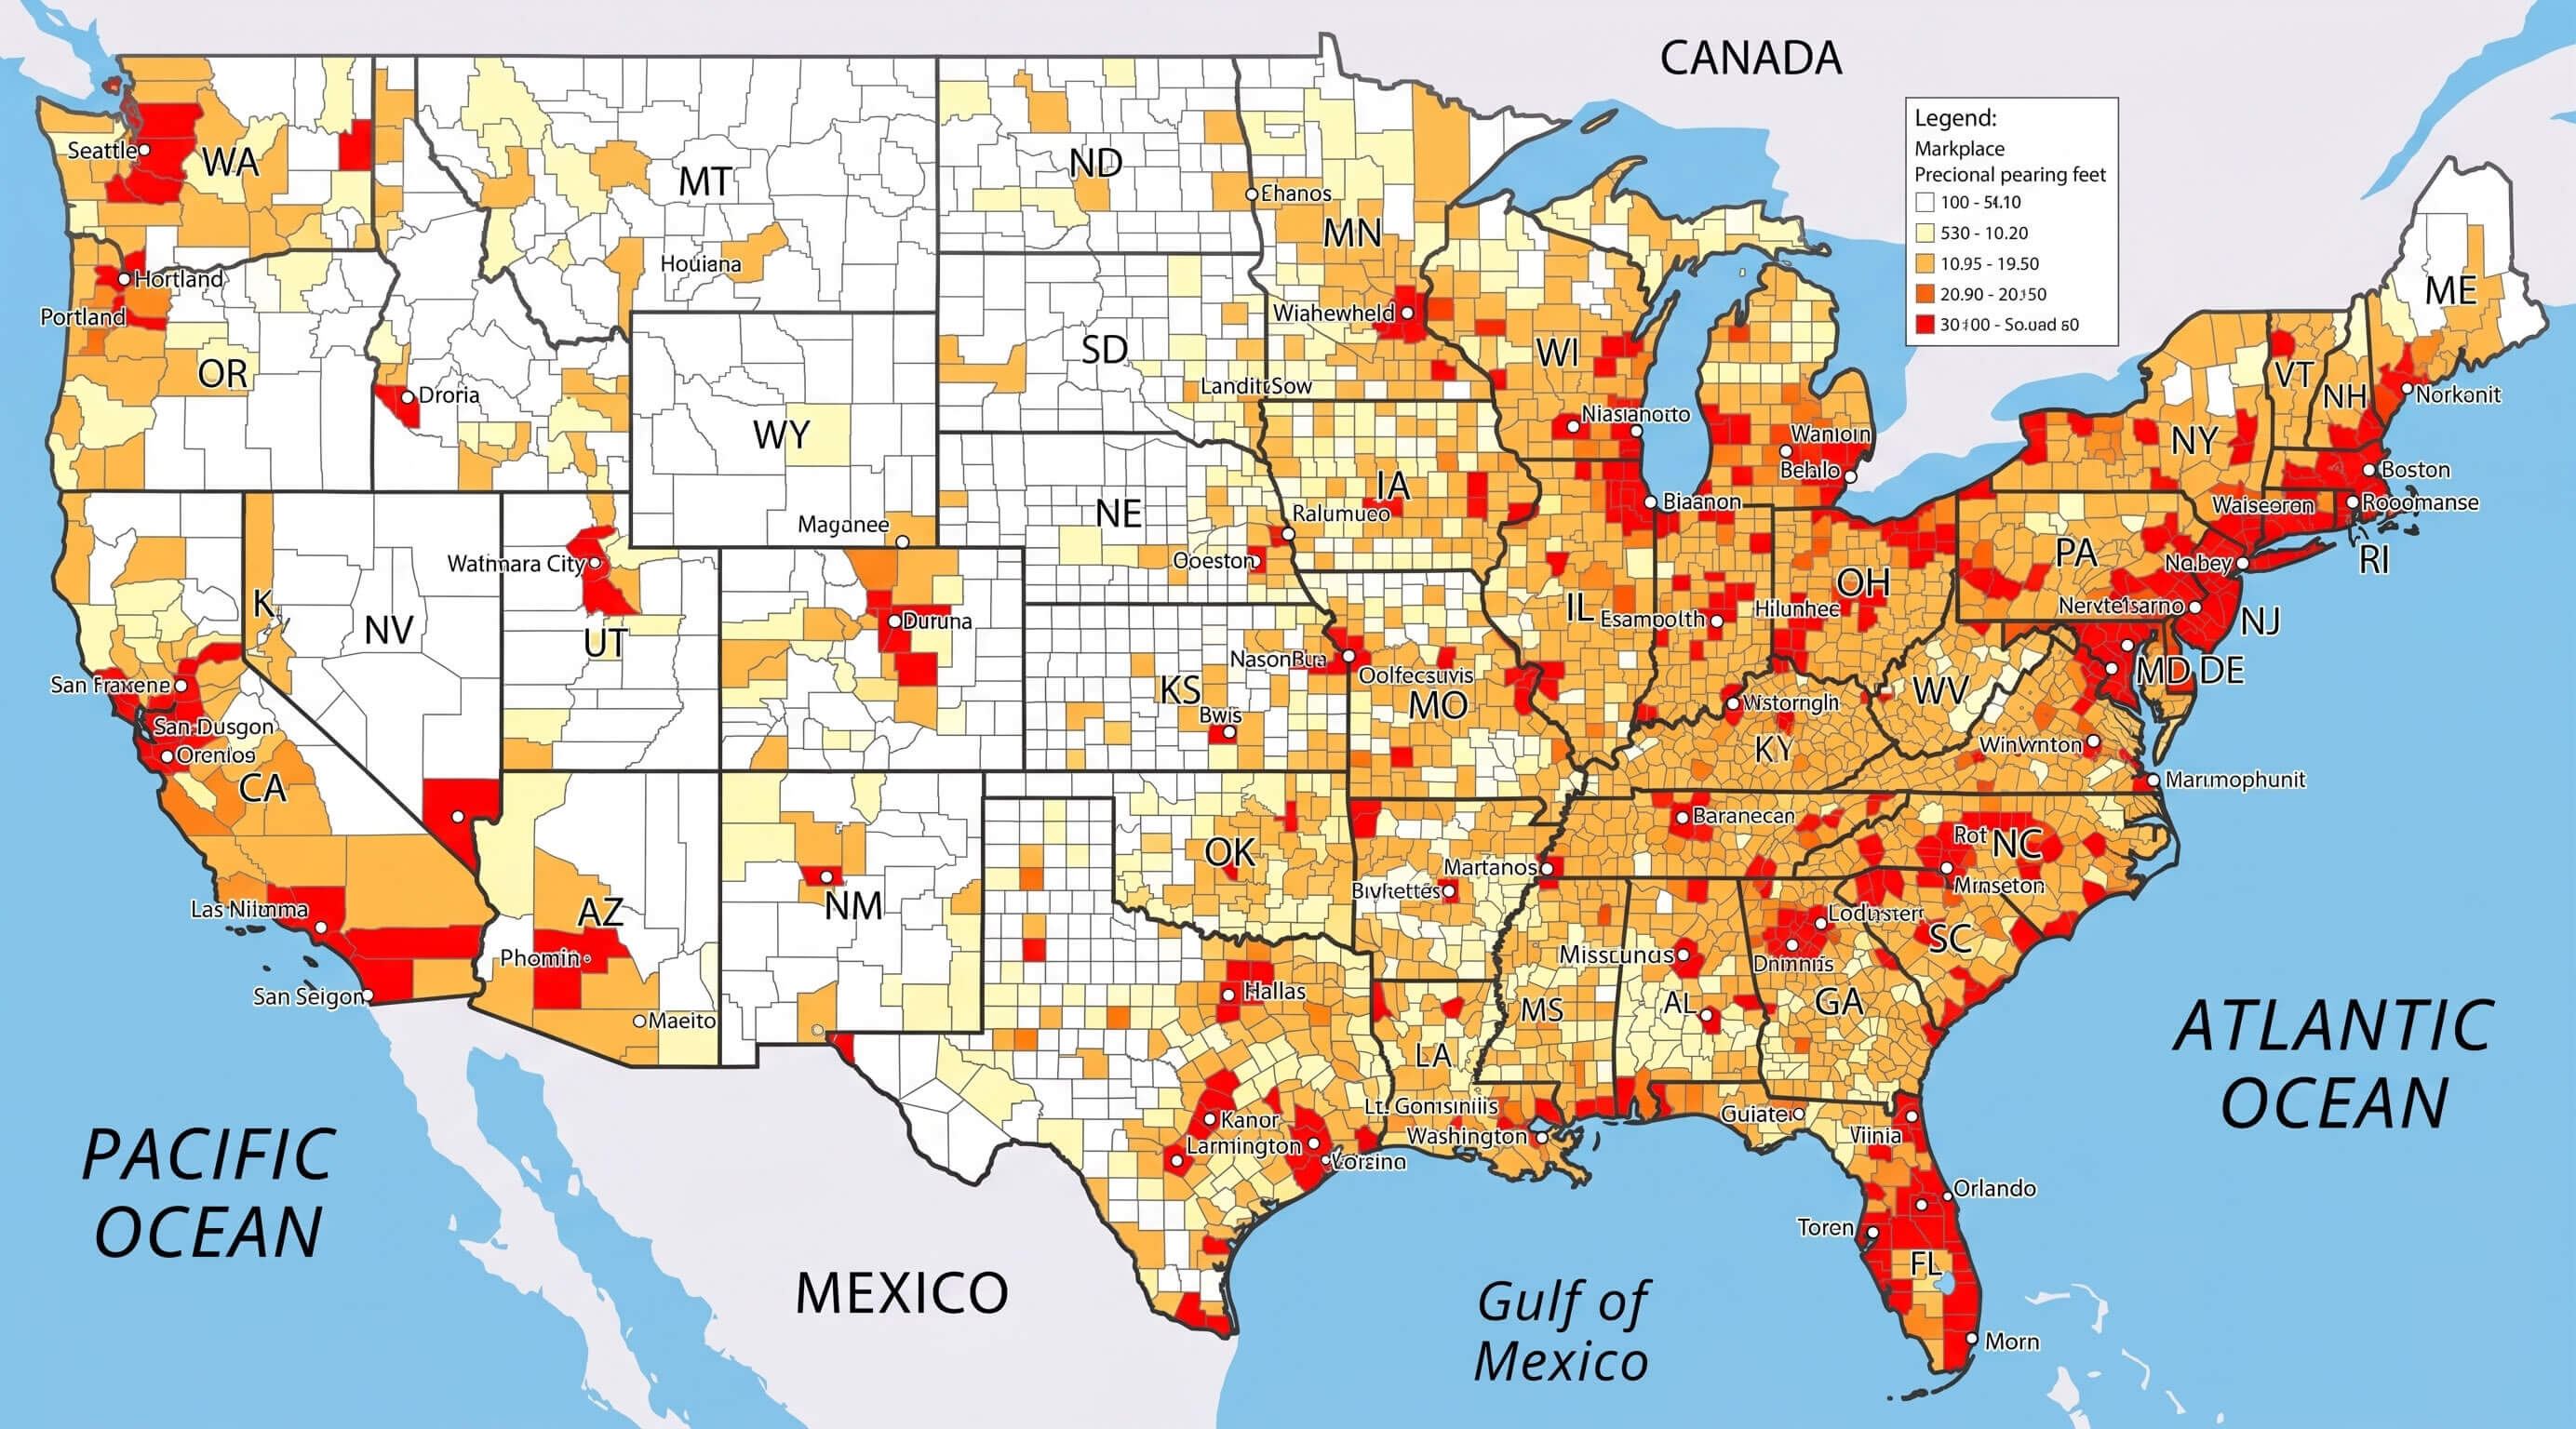
US population density by county orange scale map
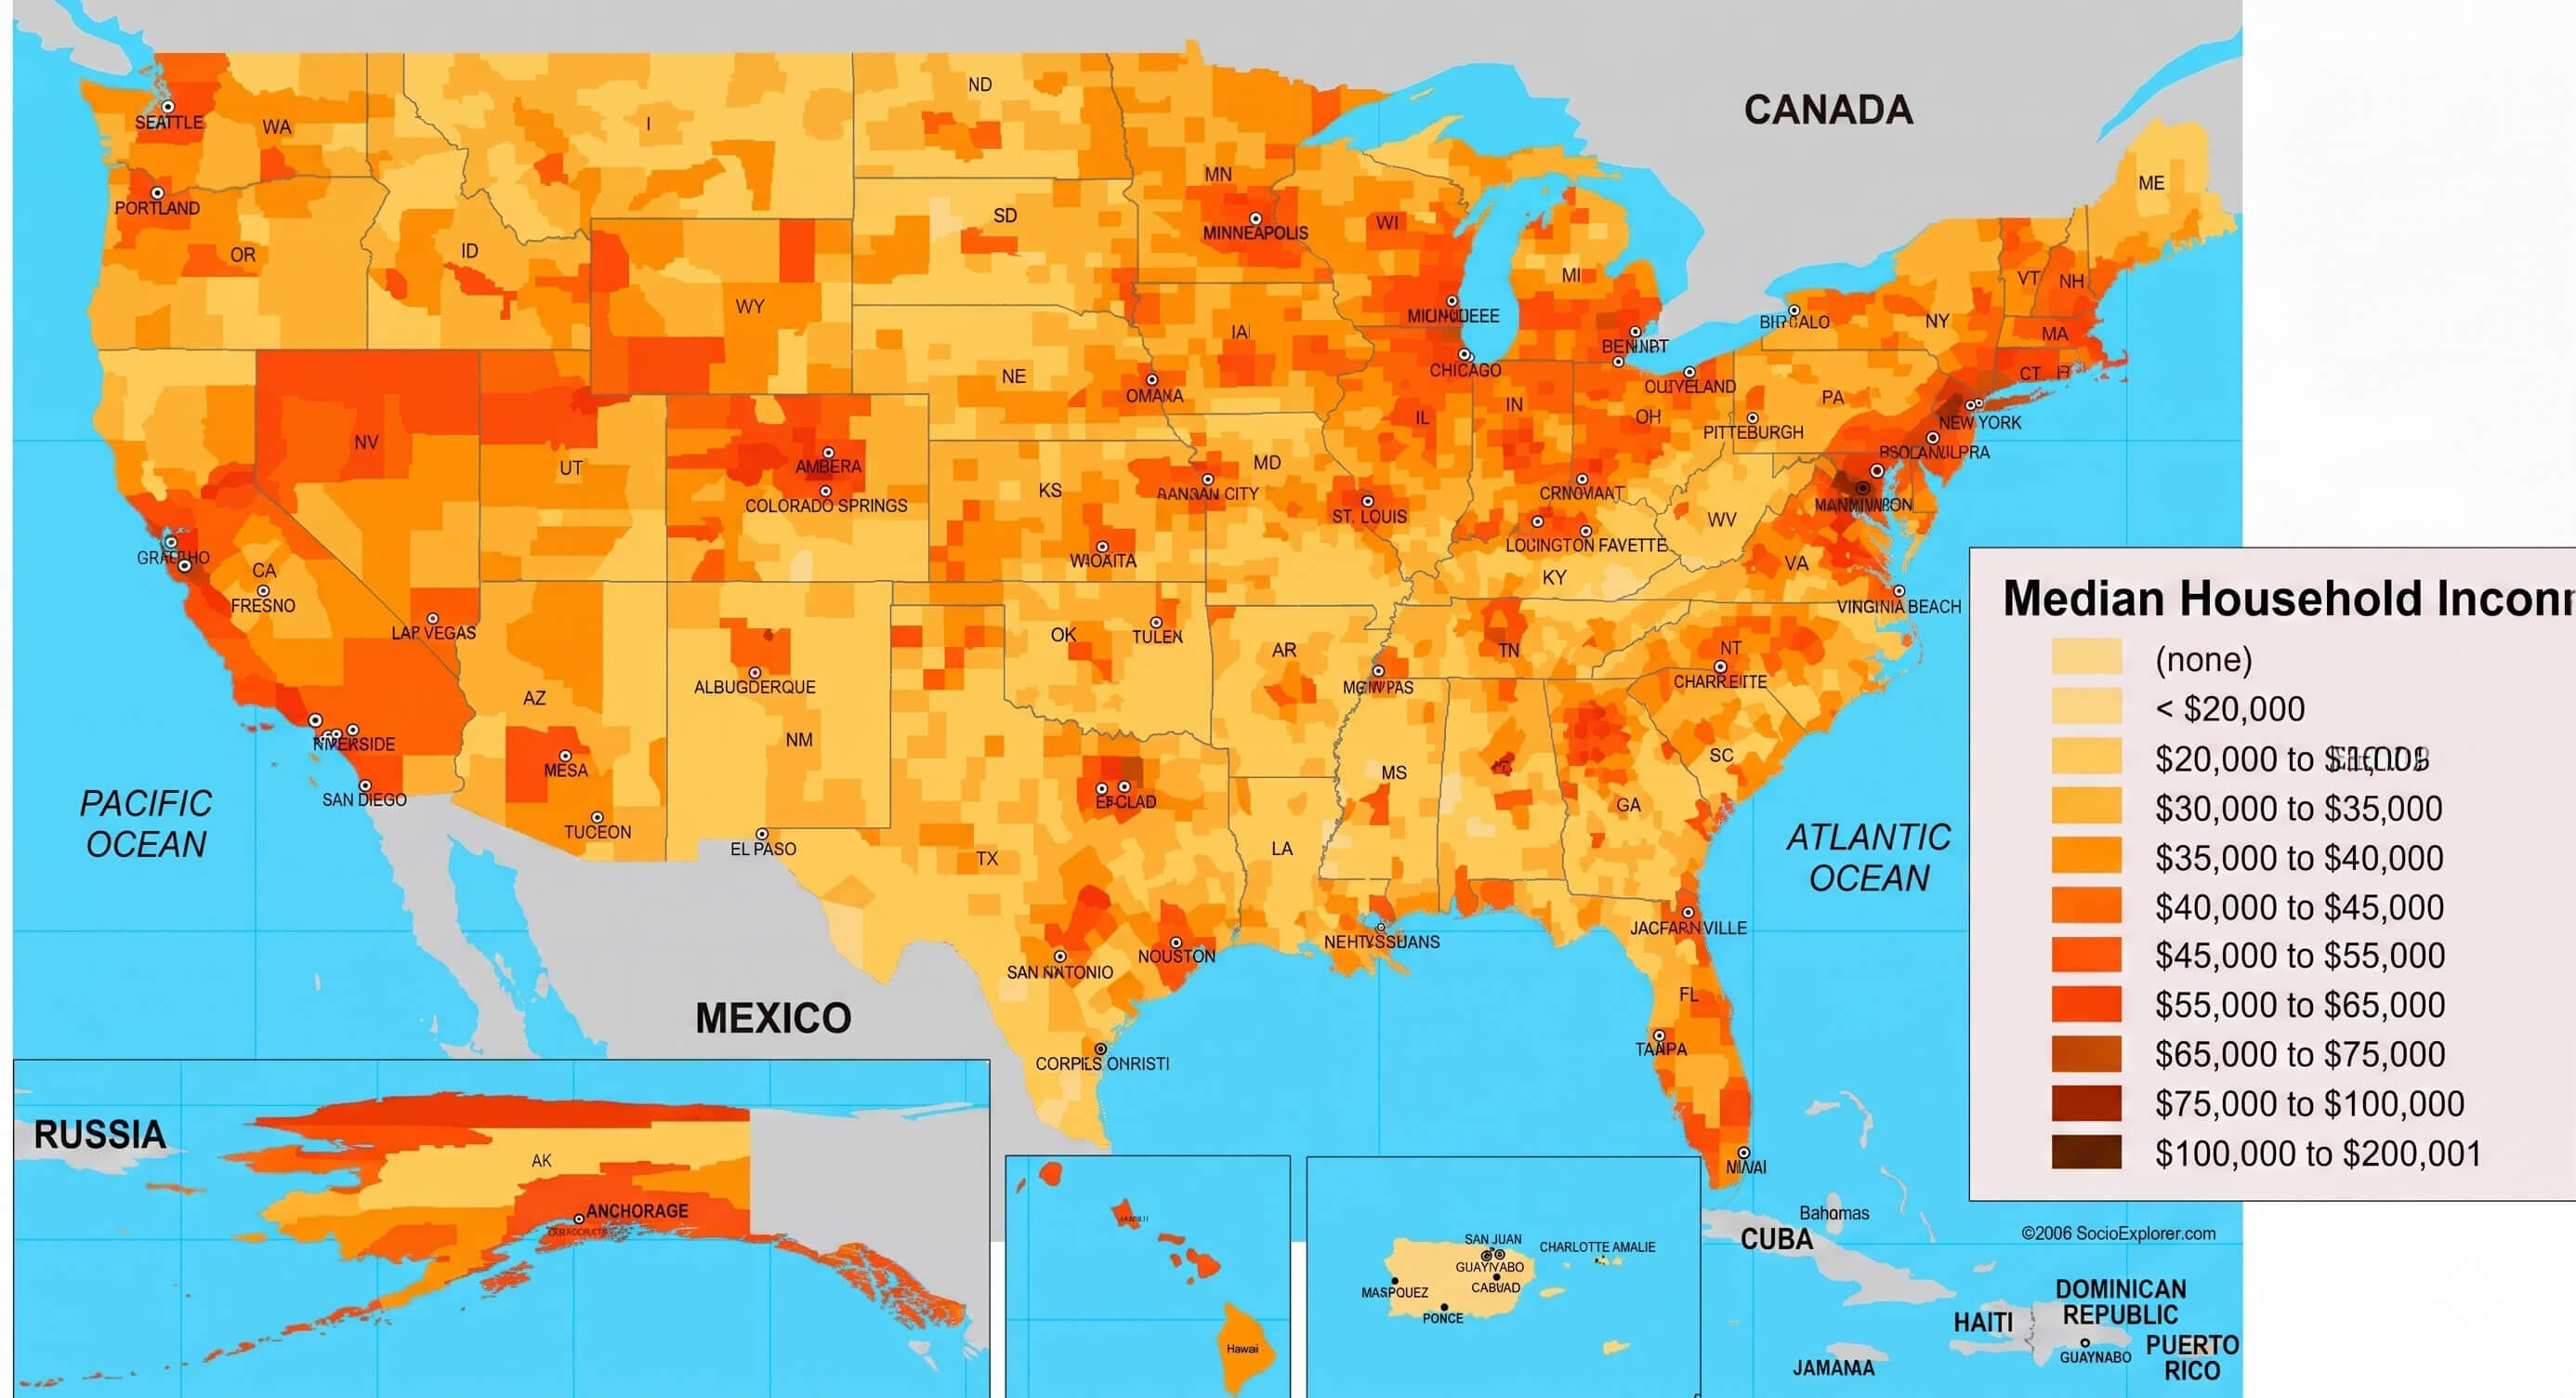
US population density infographic
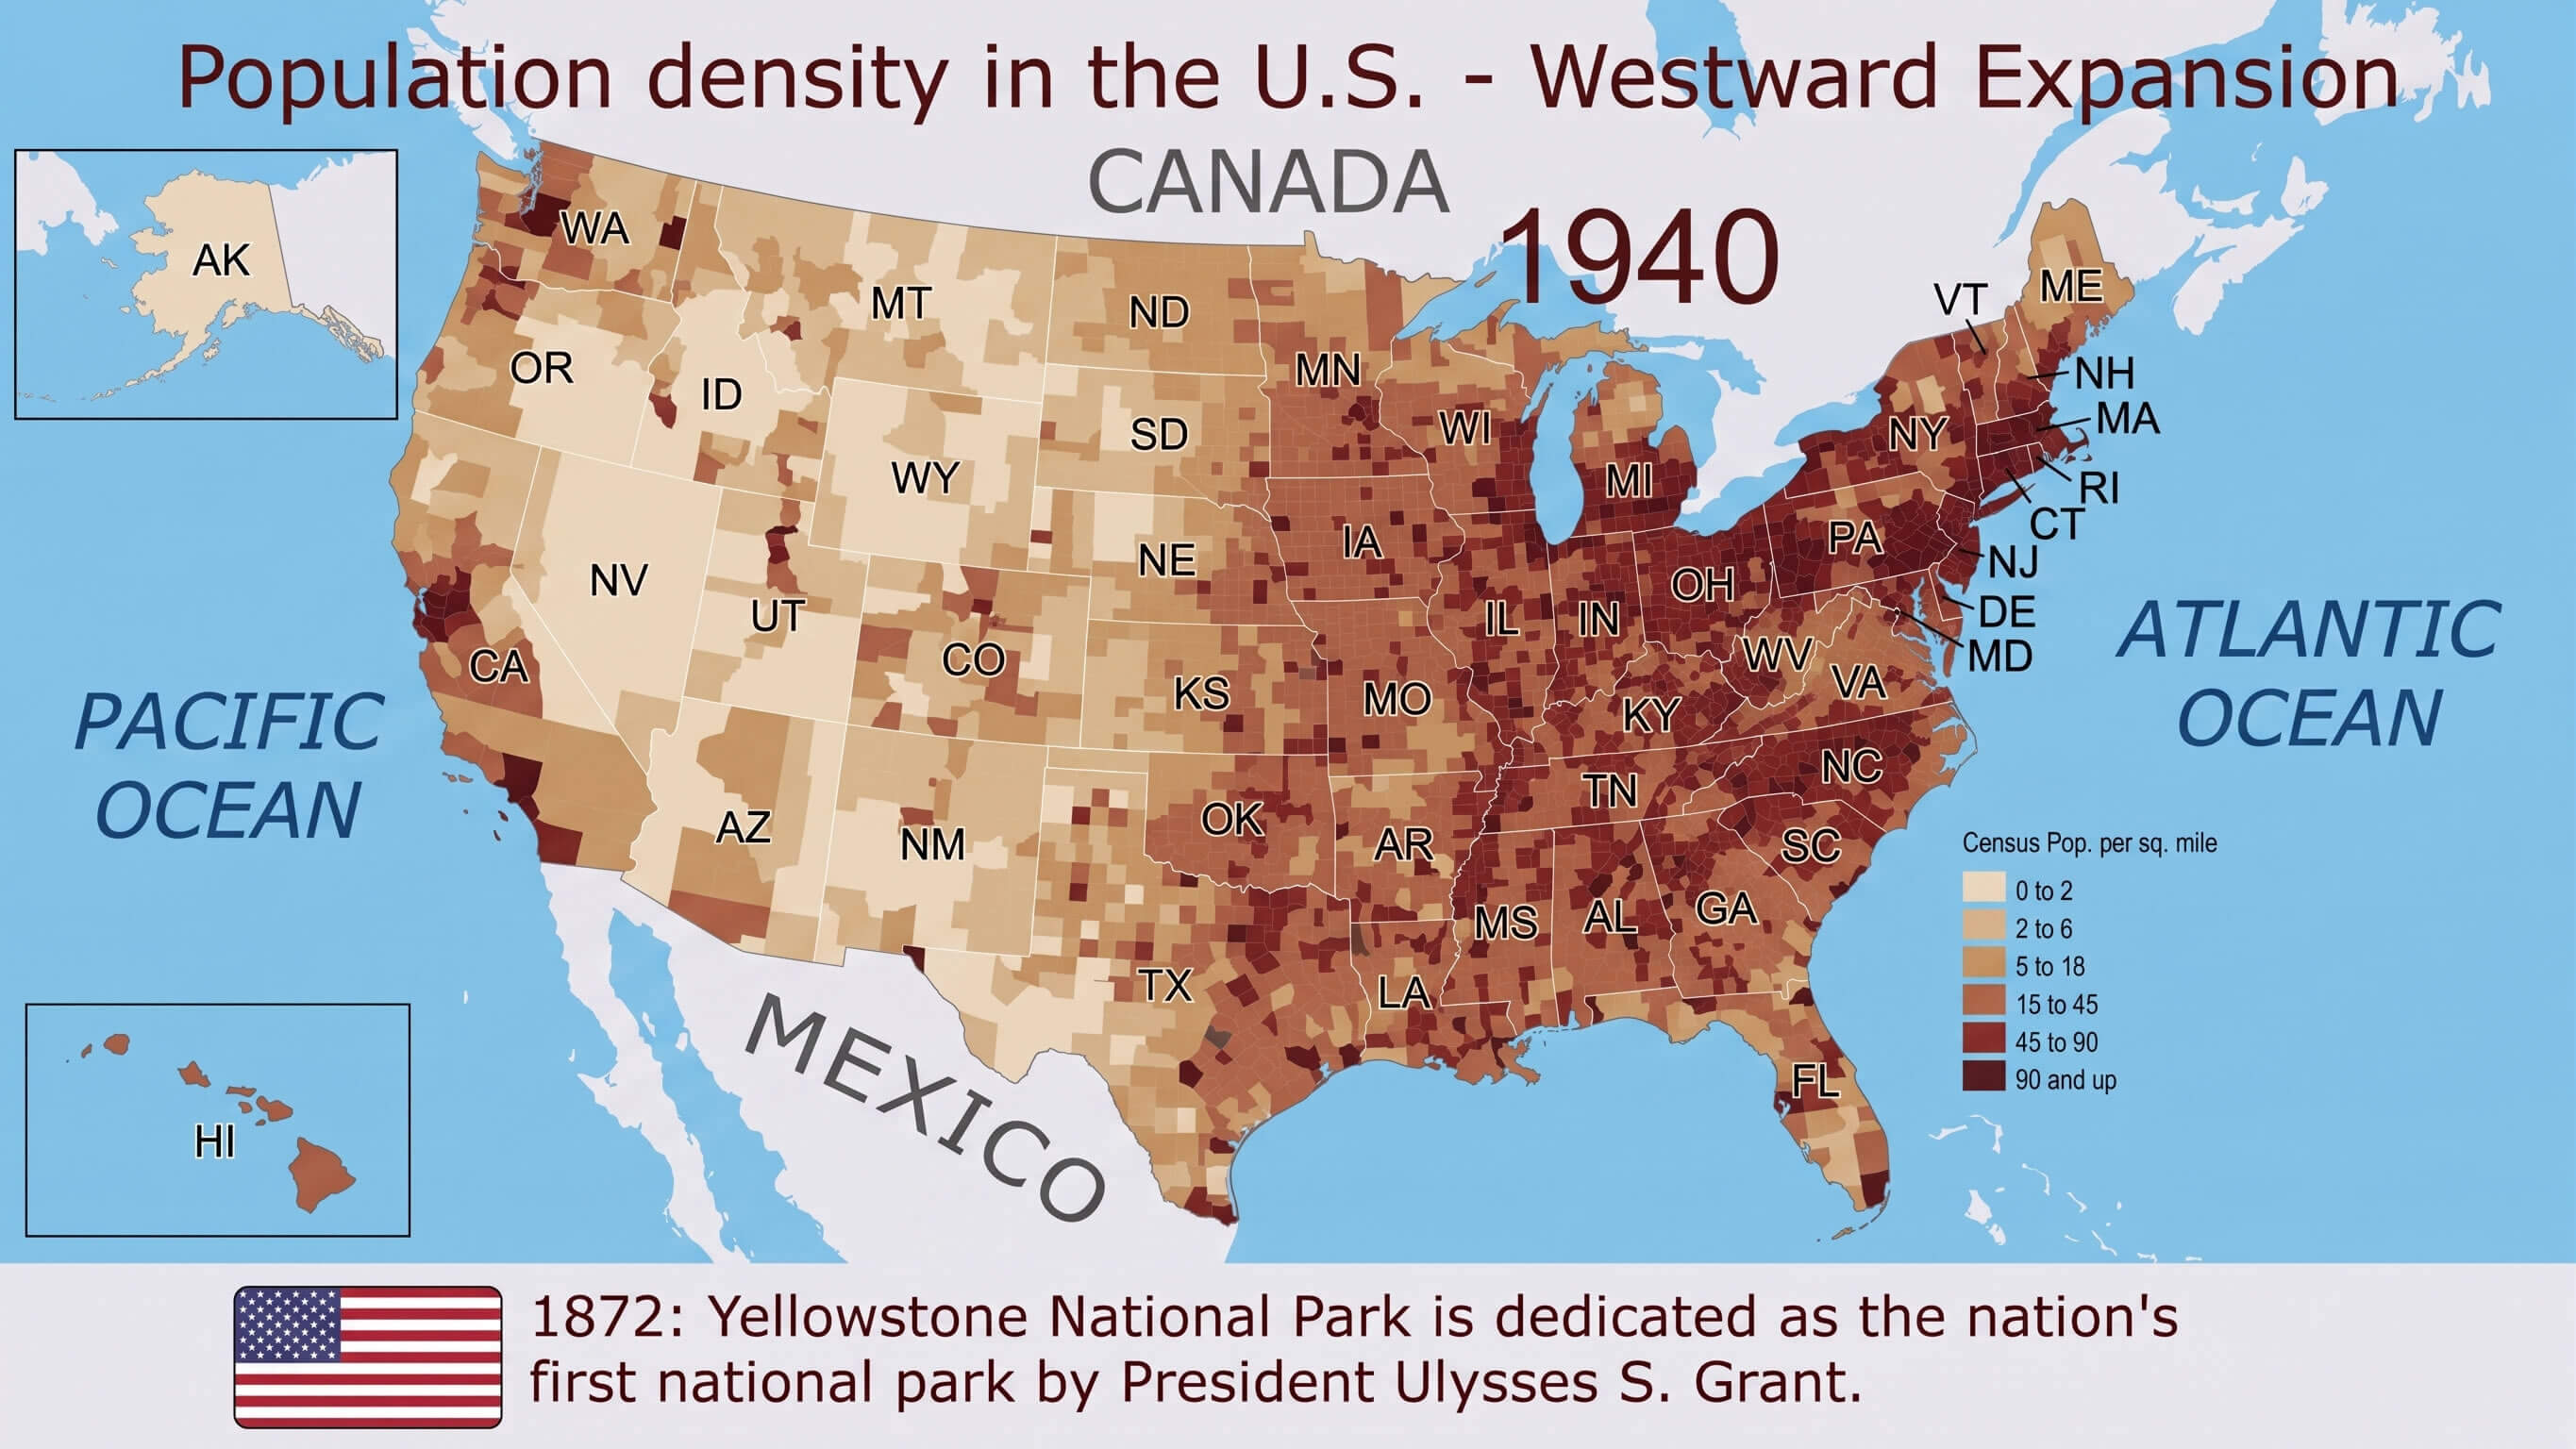
US population density westward expansion 1940 map
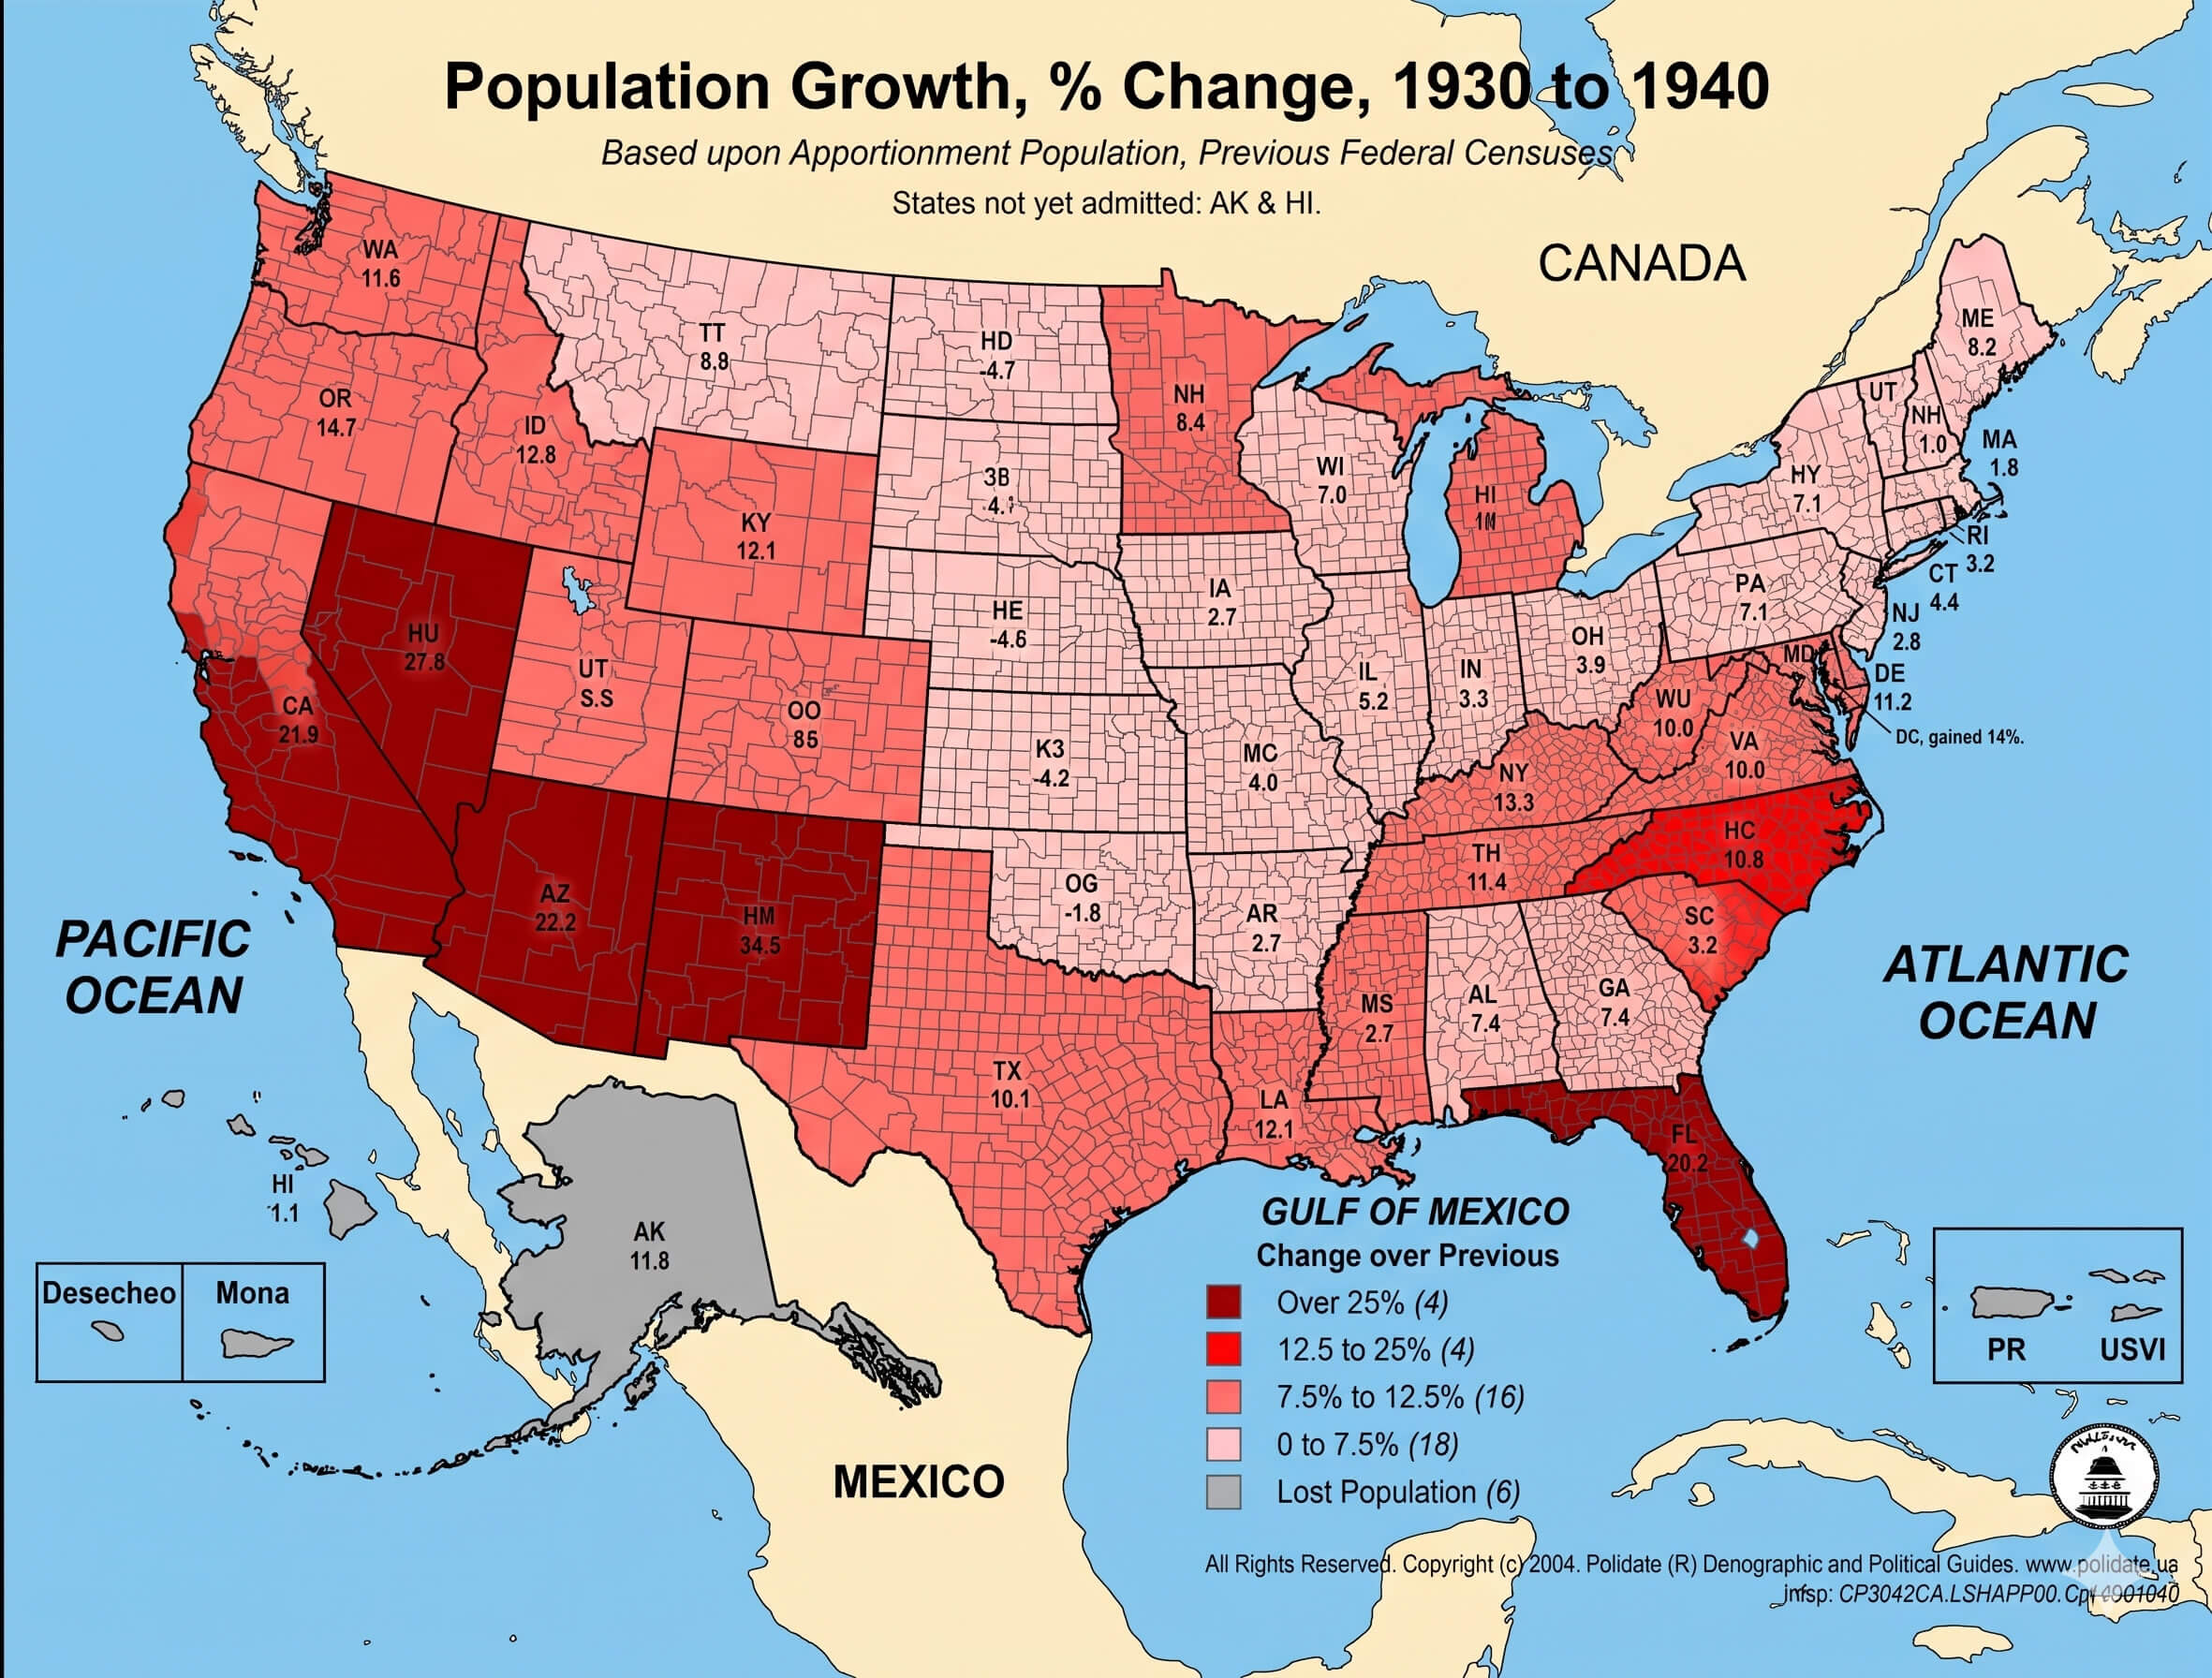
US population growth 1930 to 1940 map
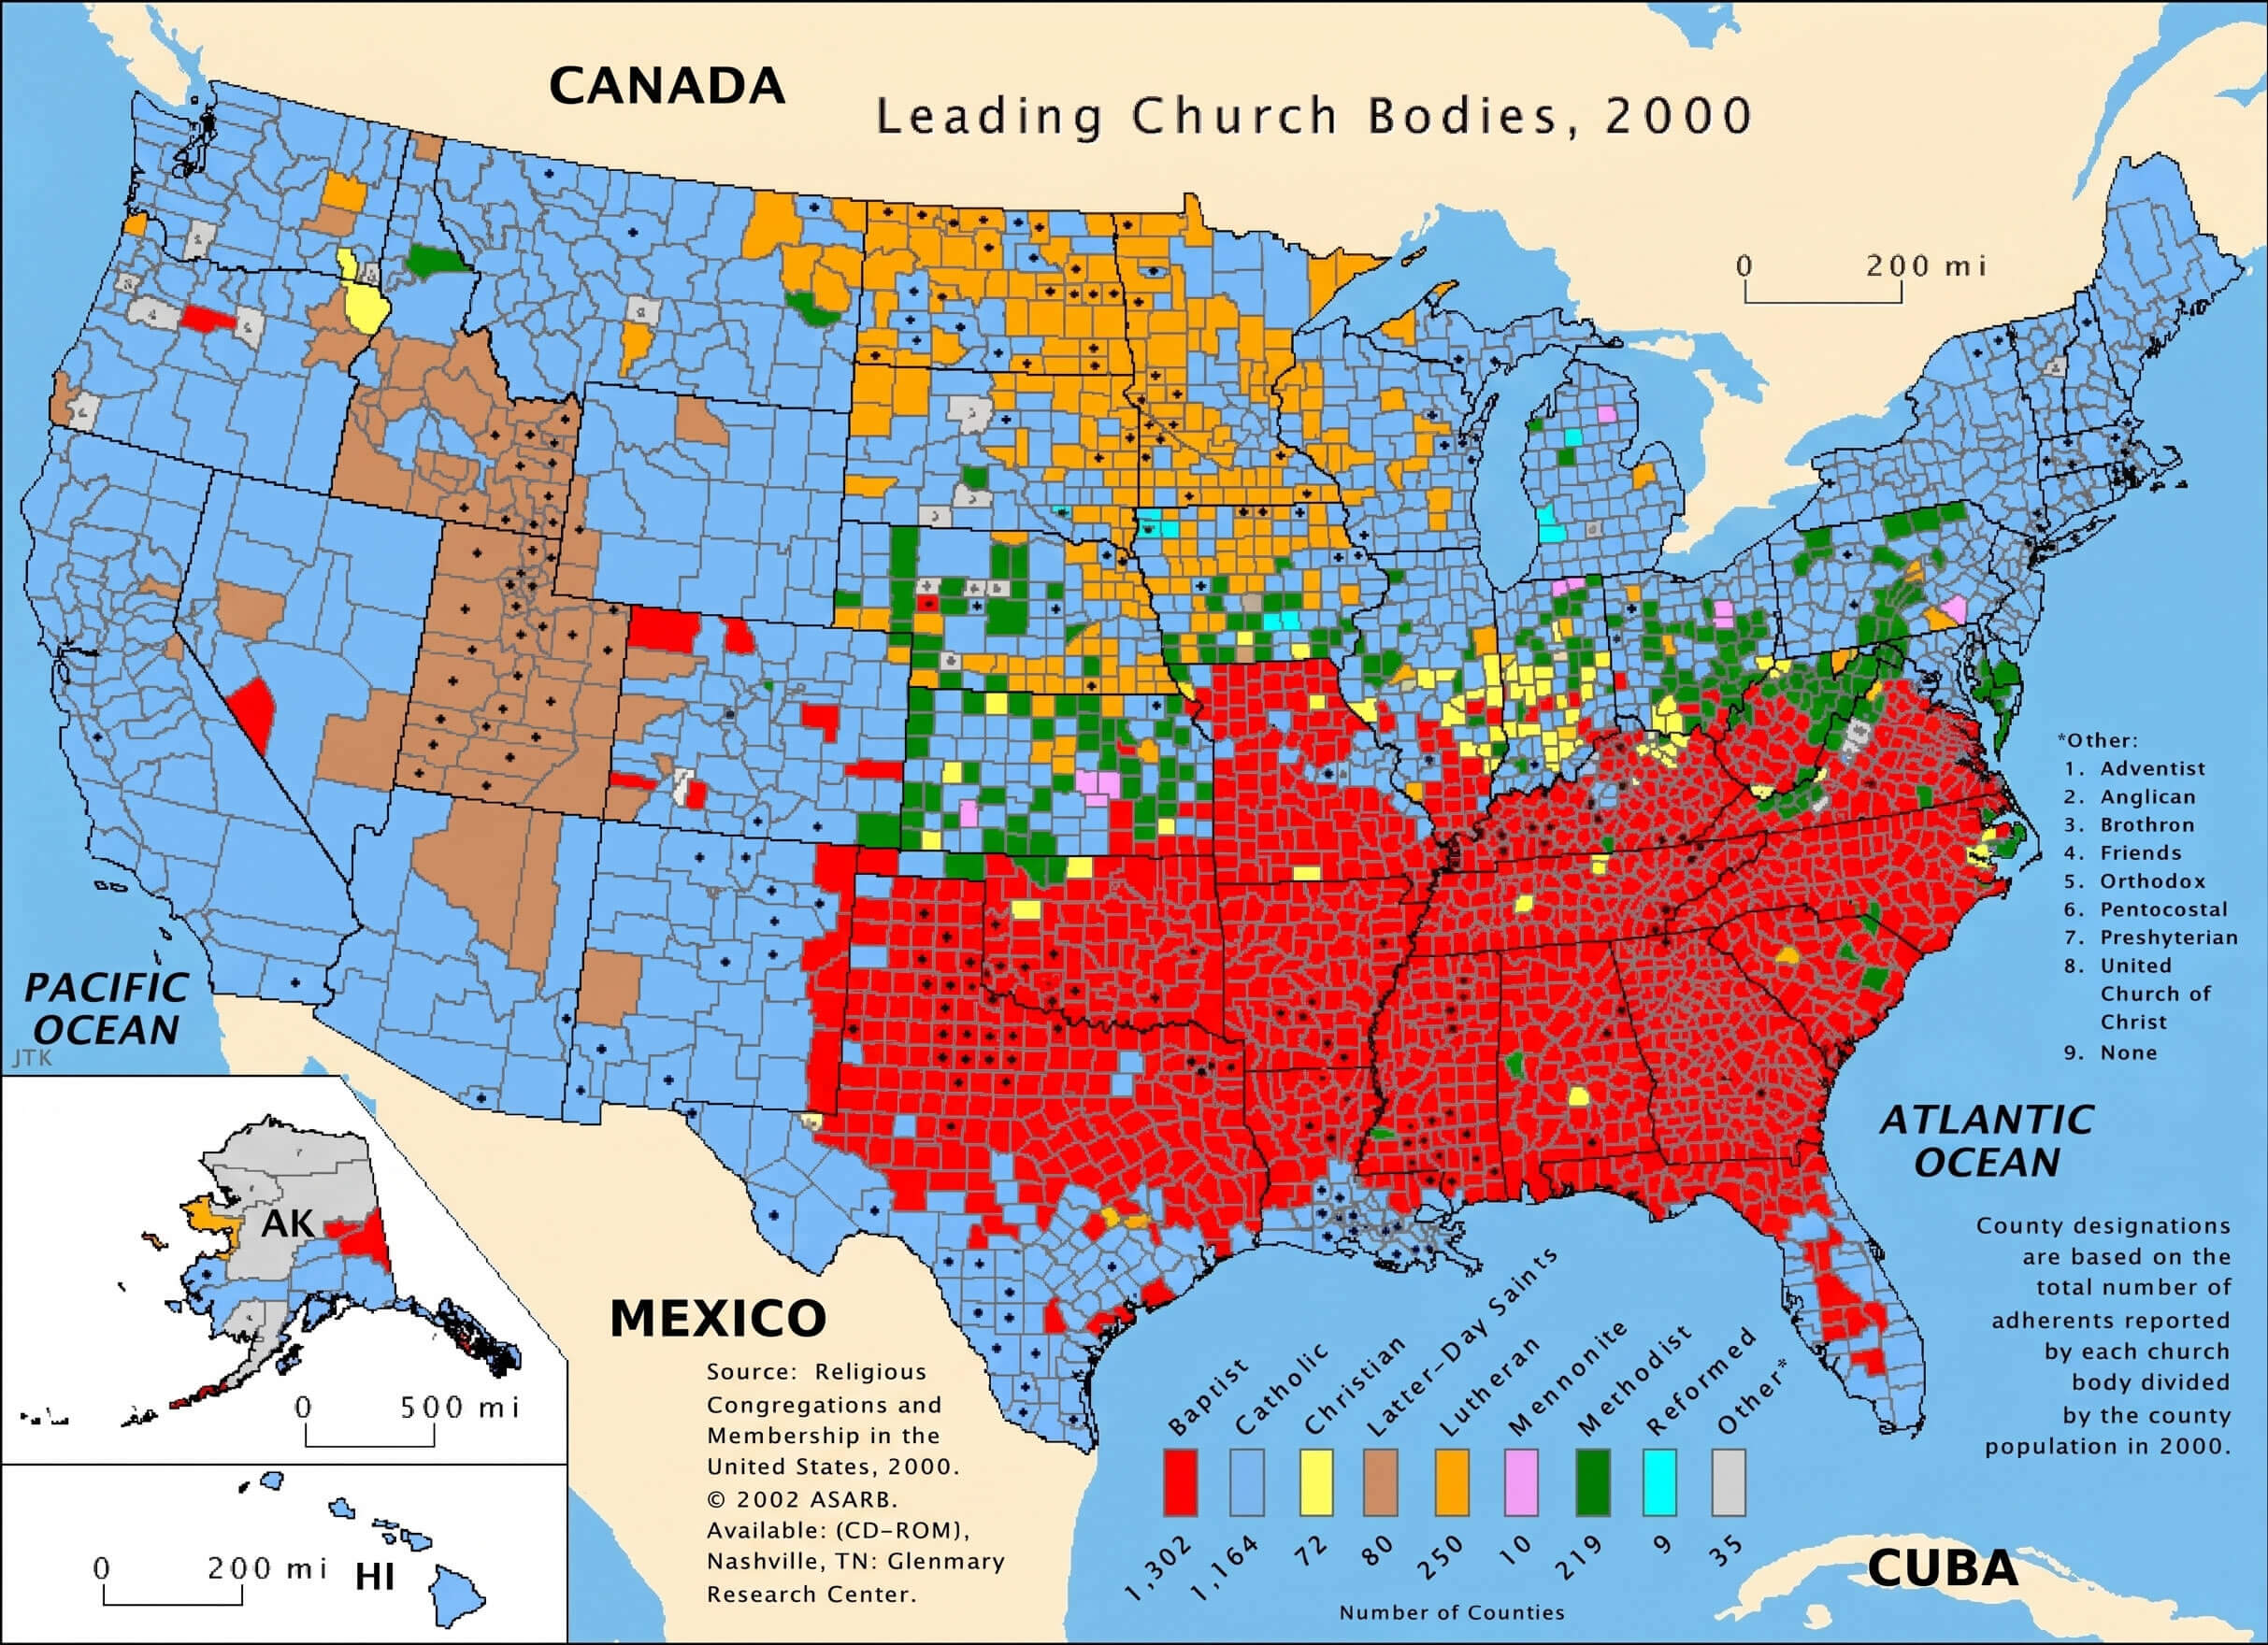
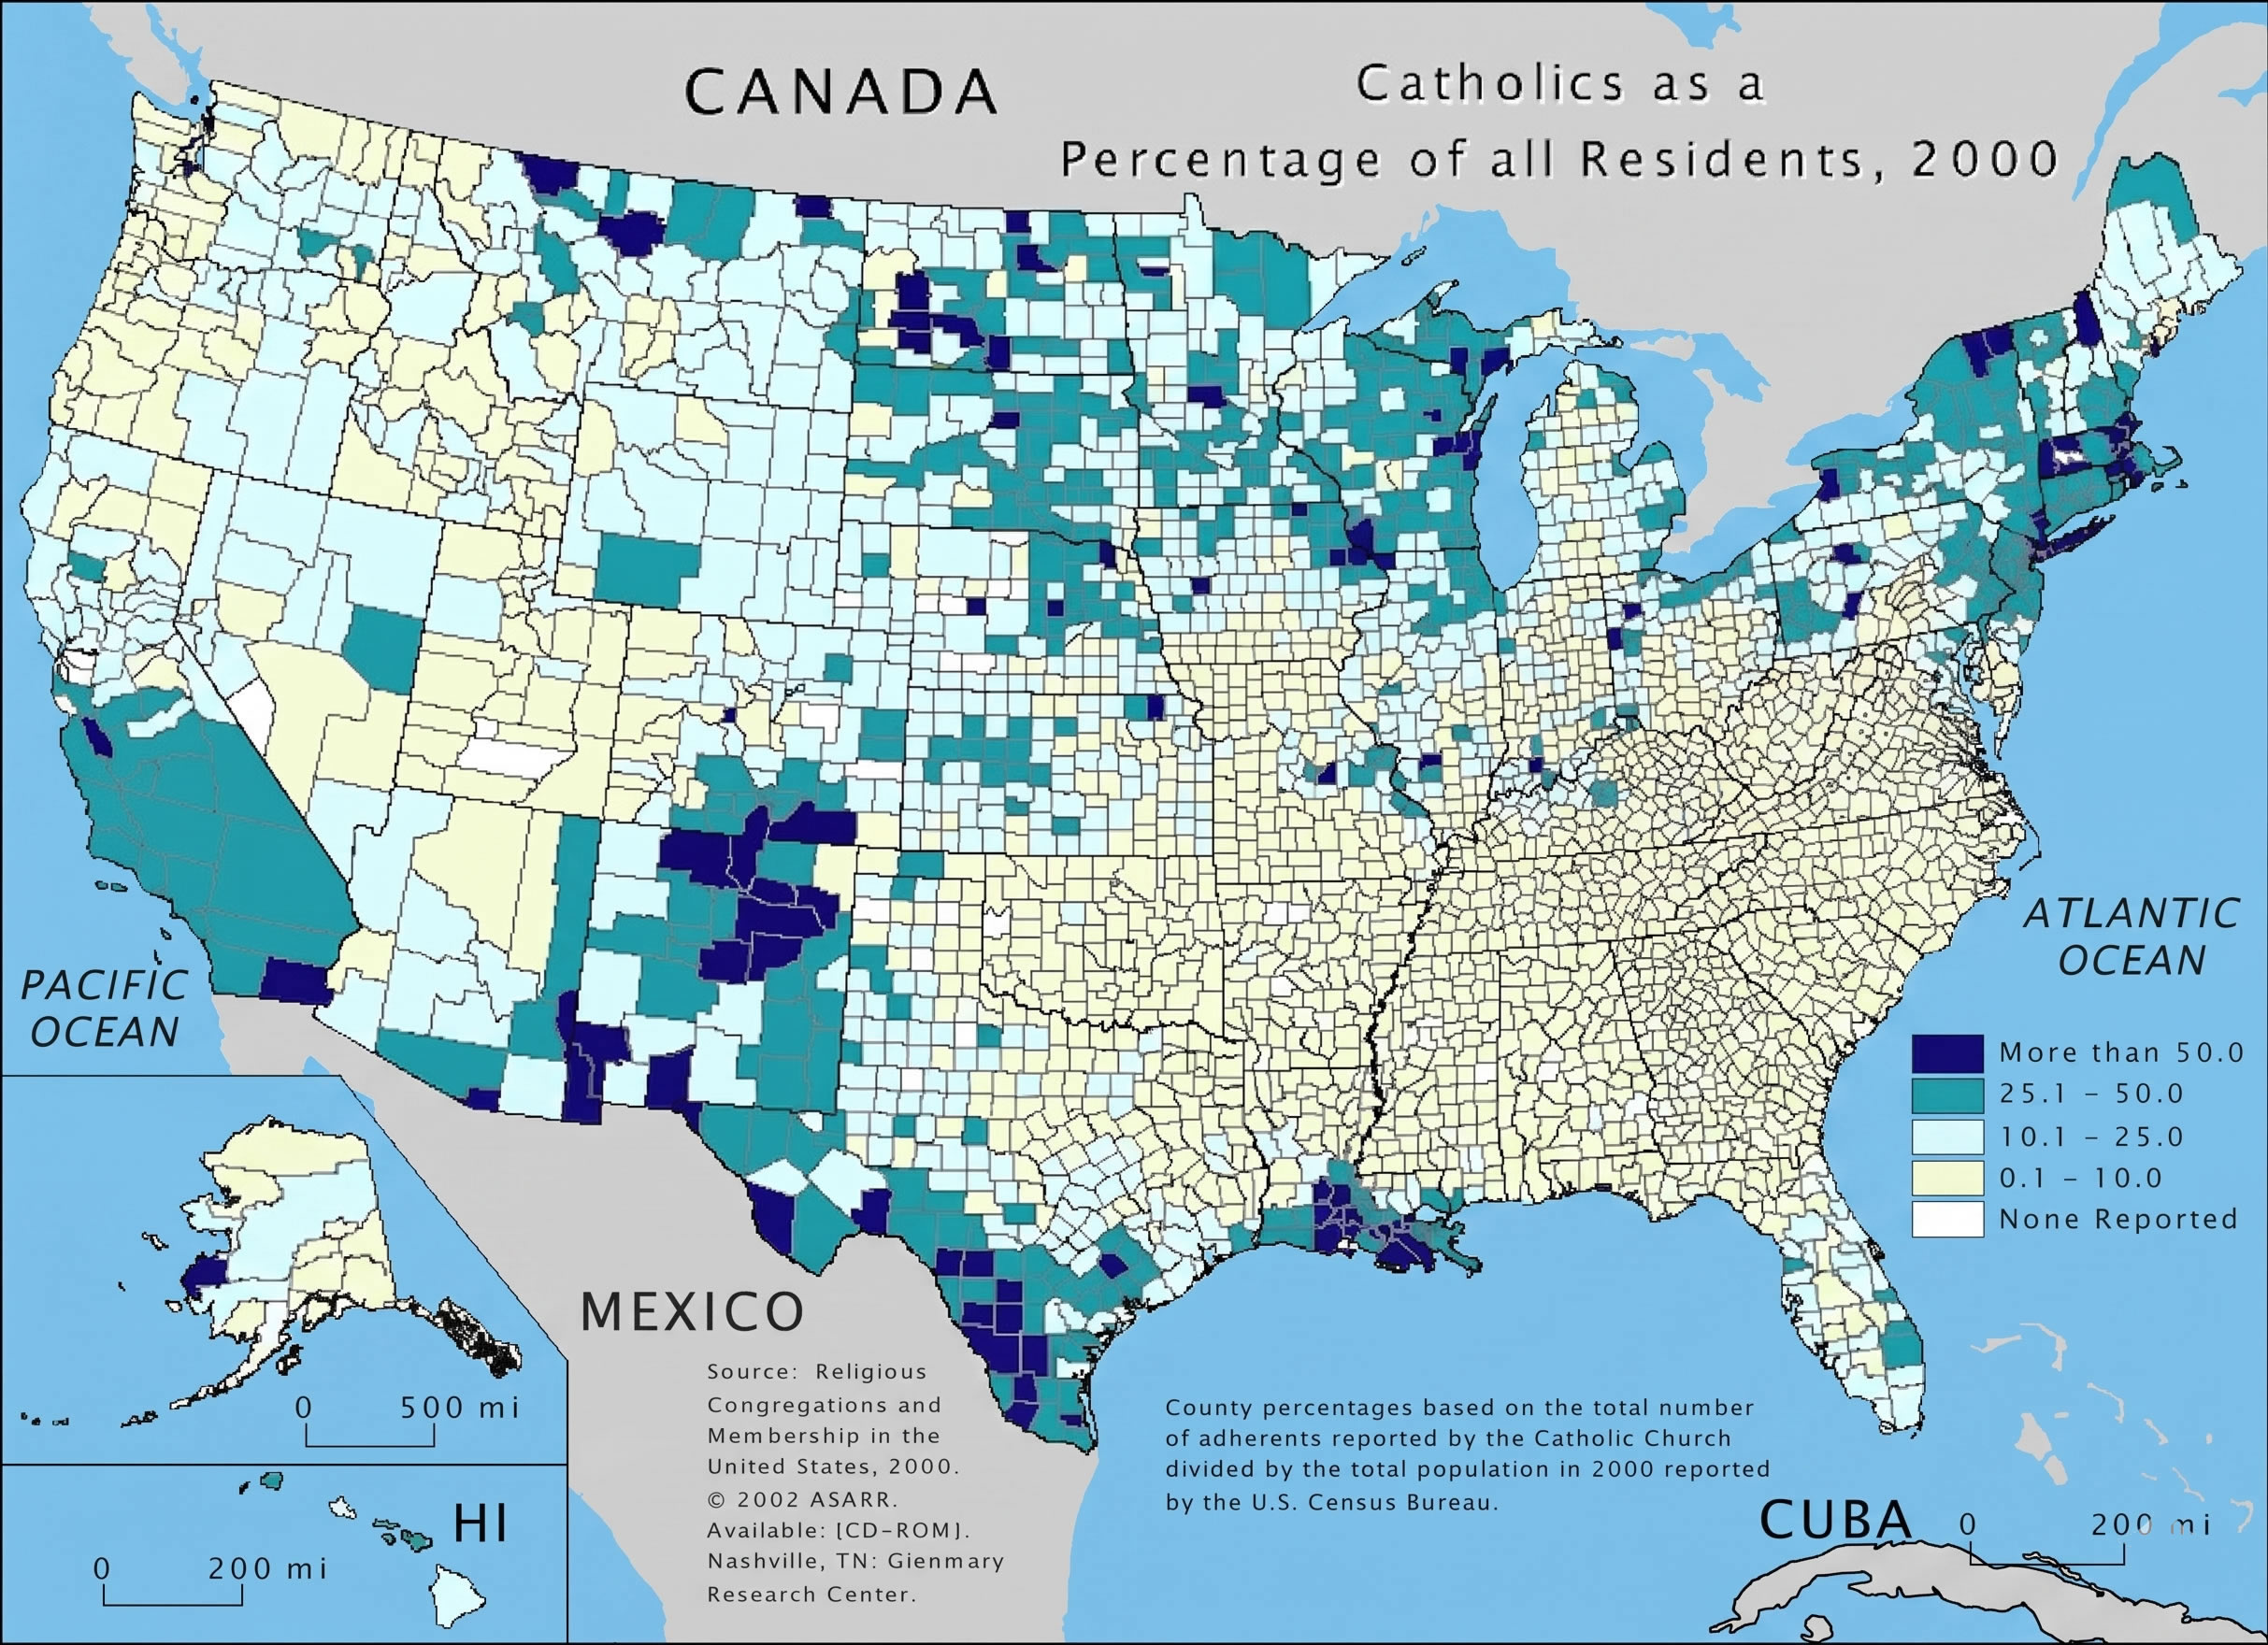
US religious distribution map by region 2000
US state population map 2024
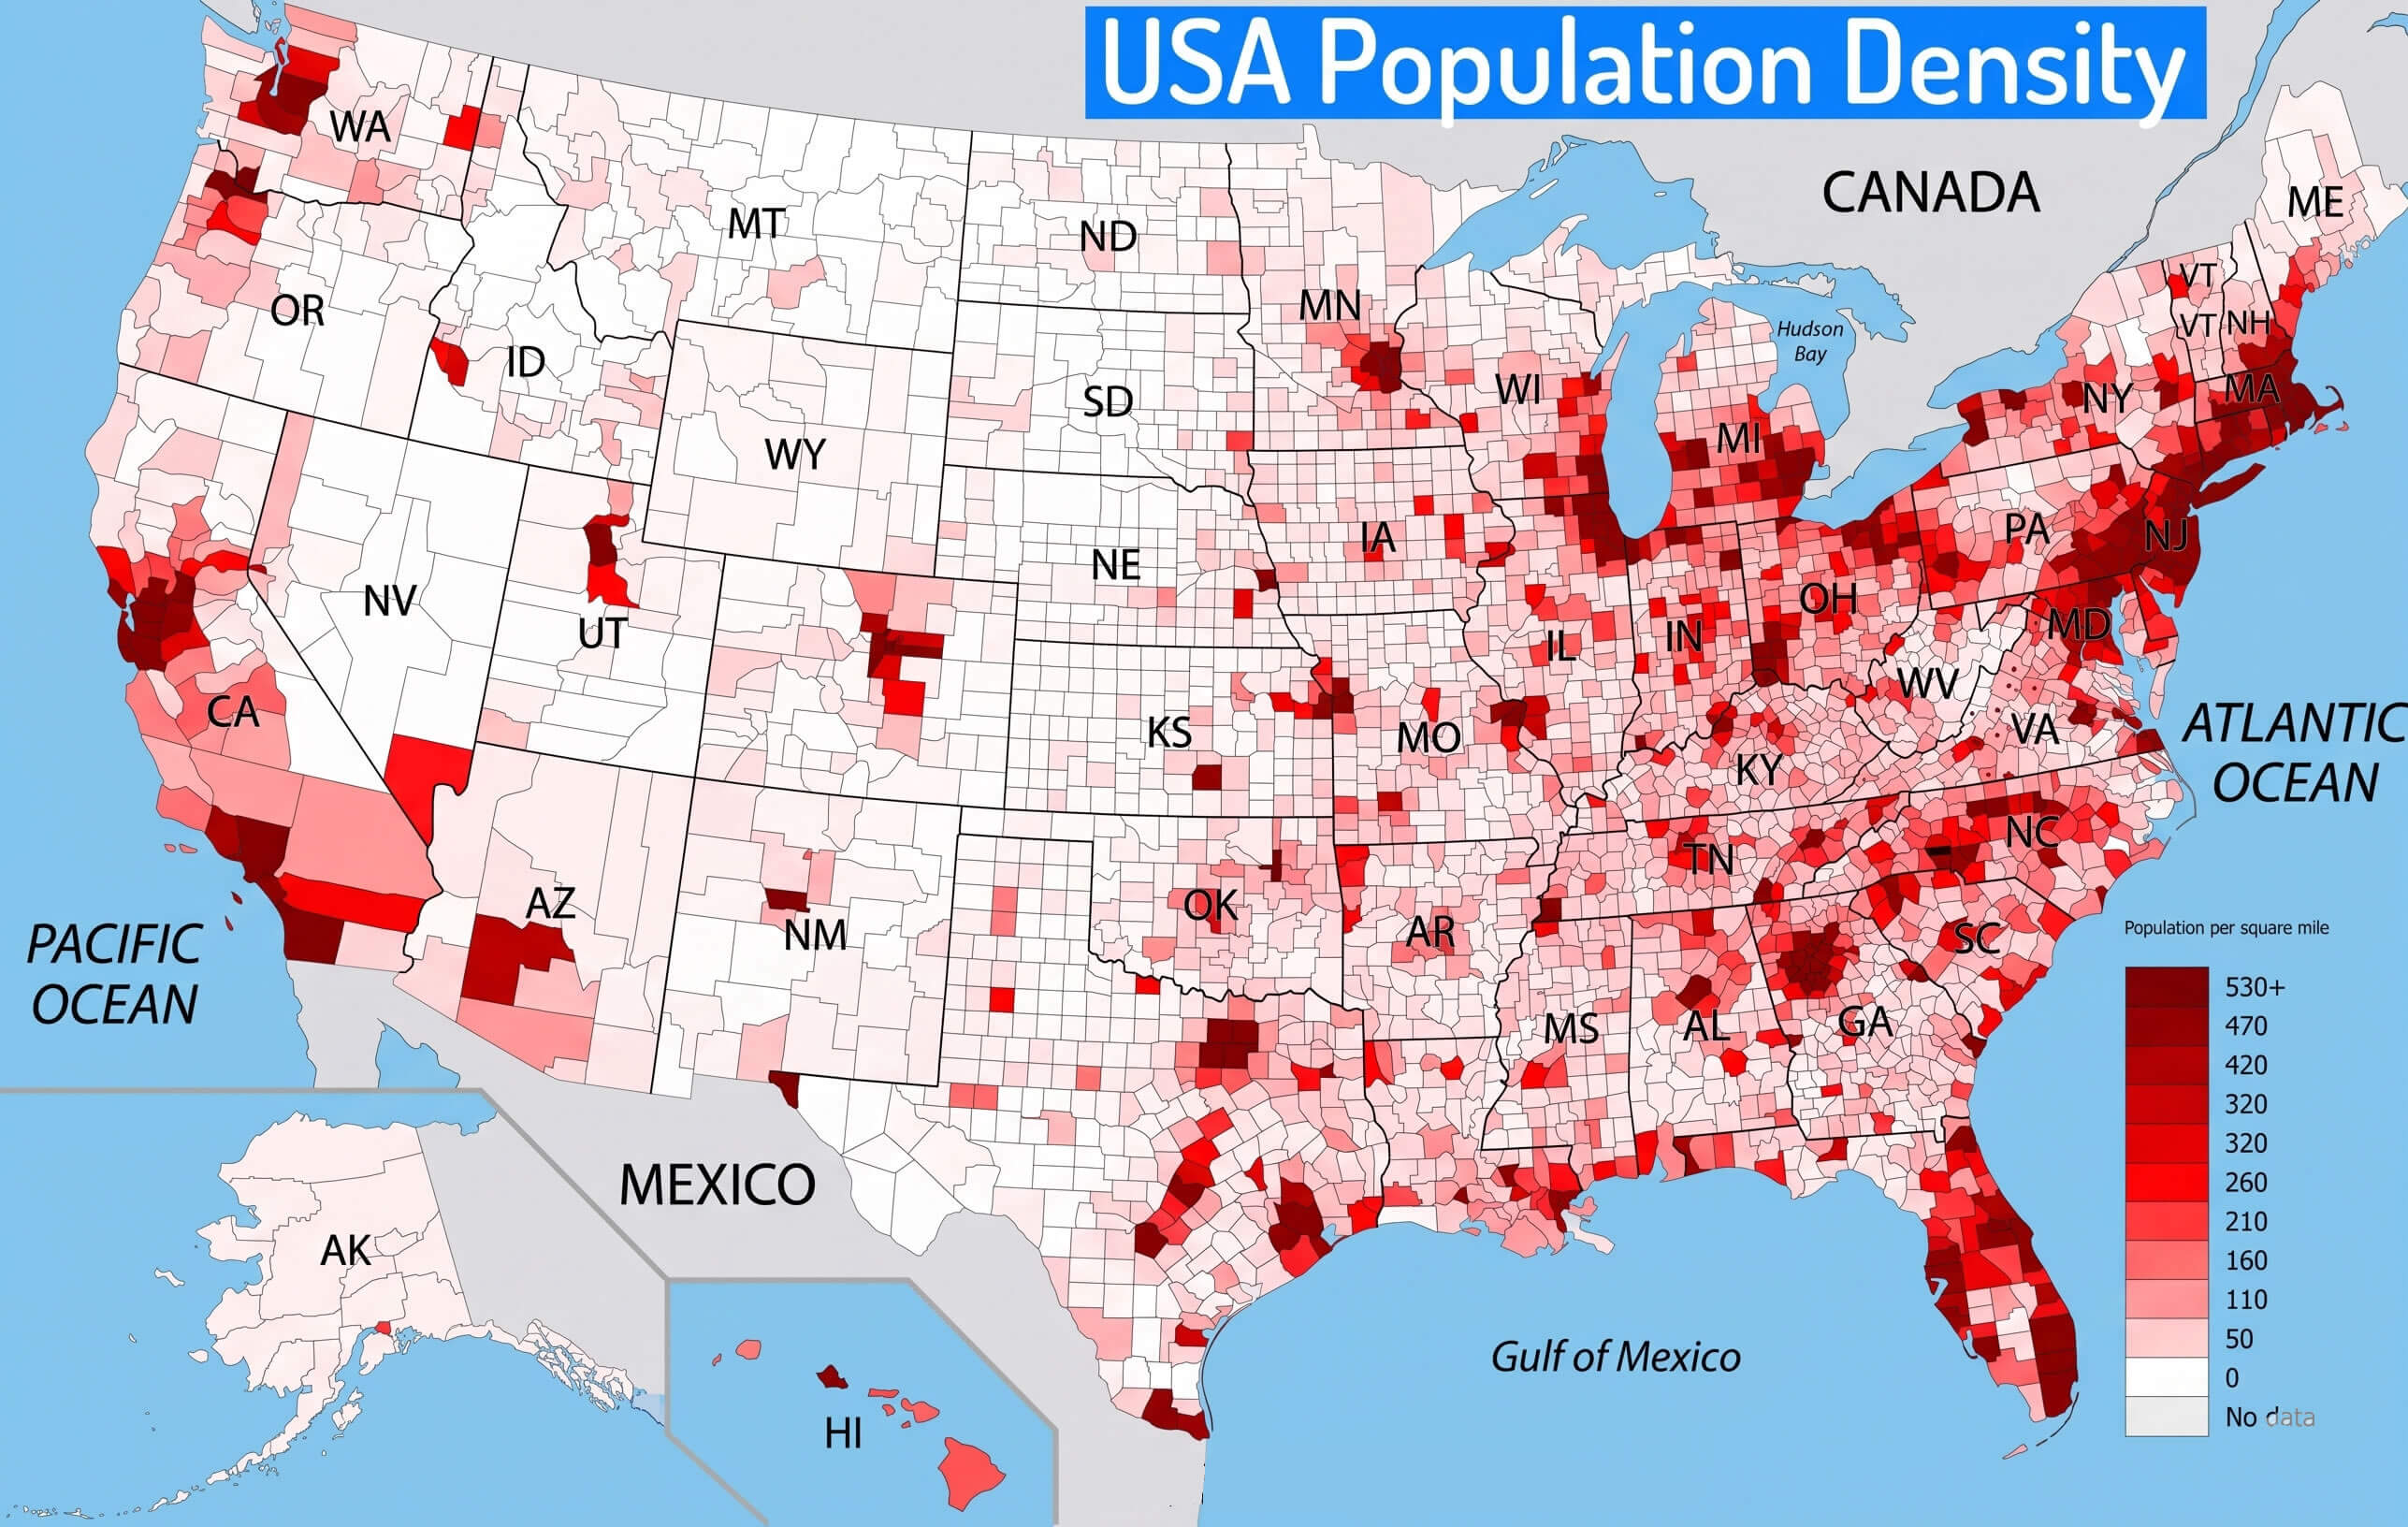
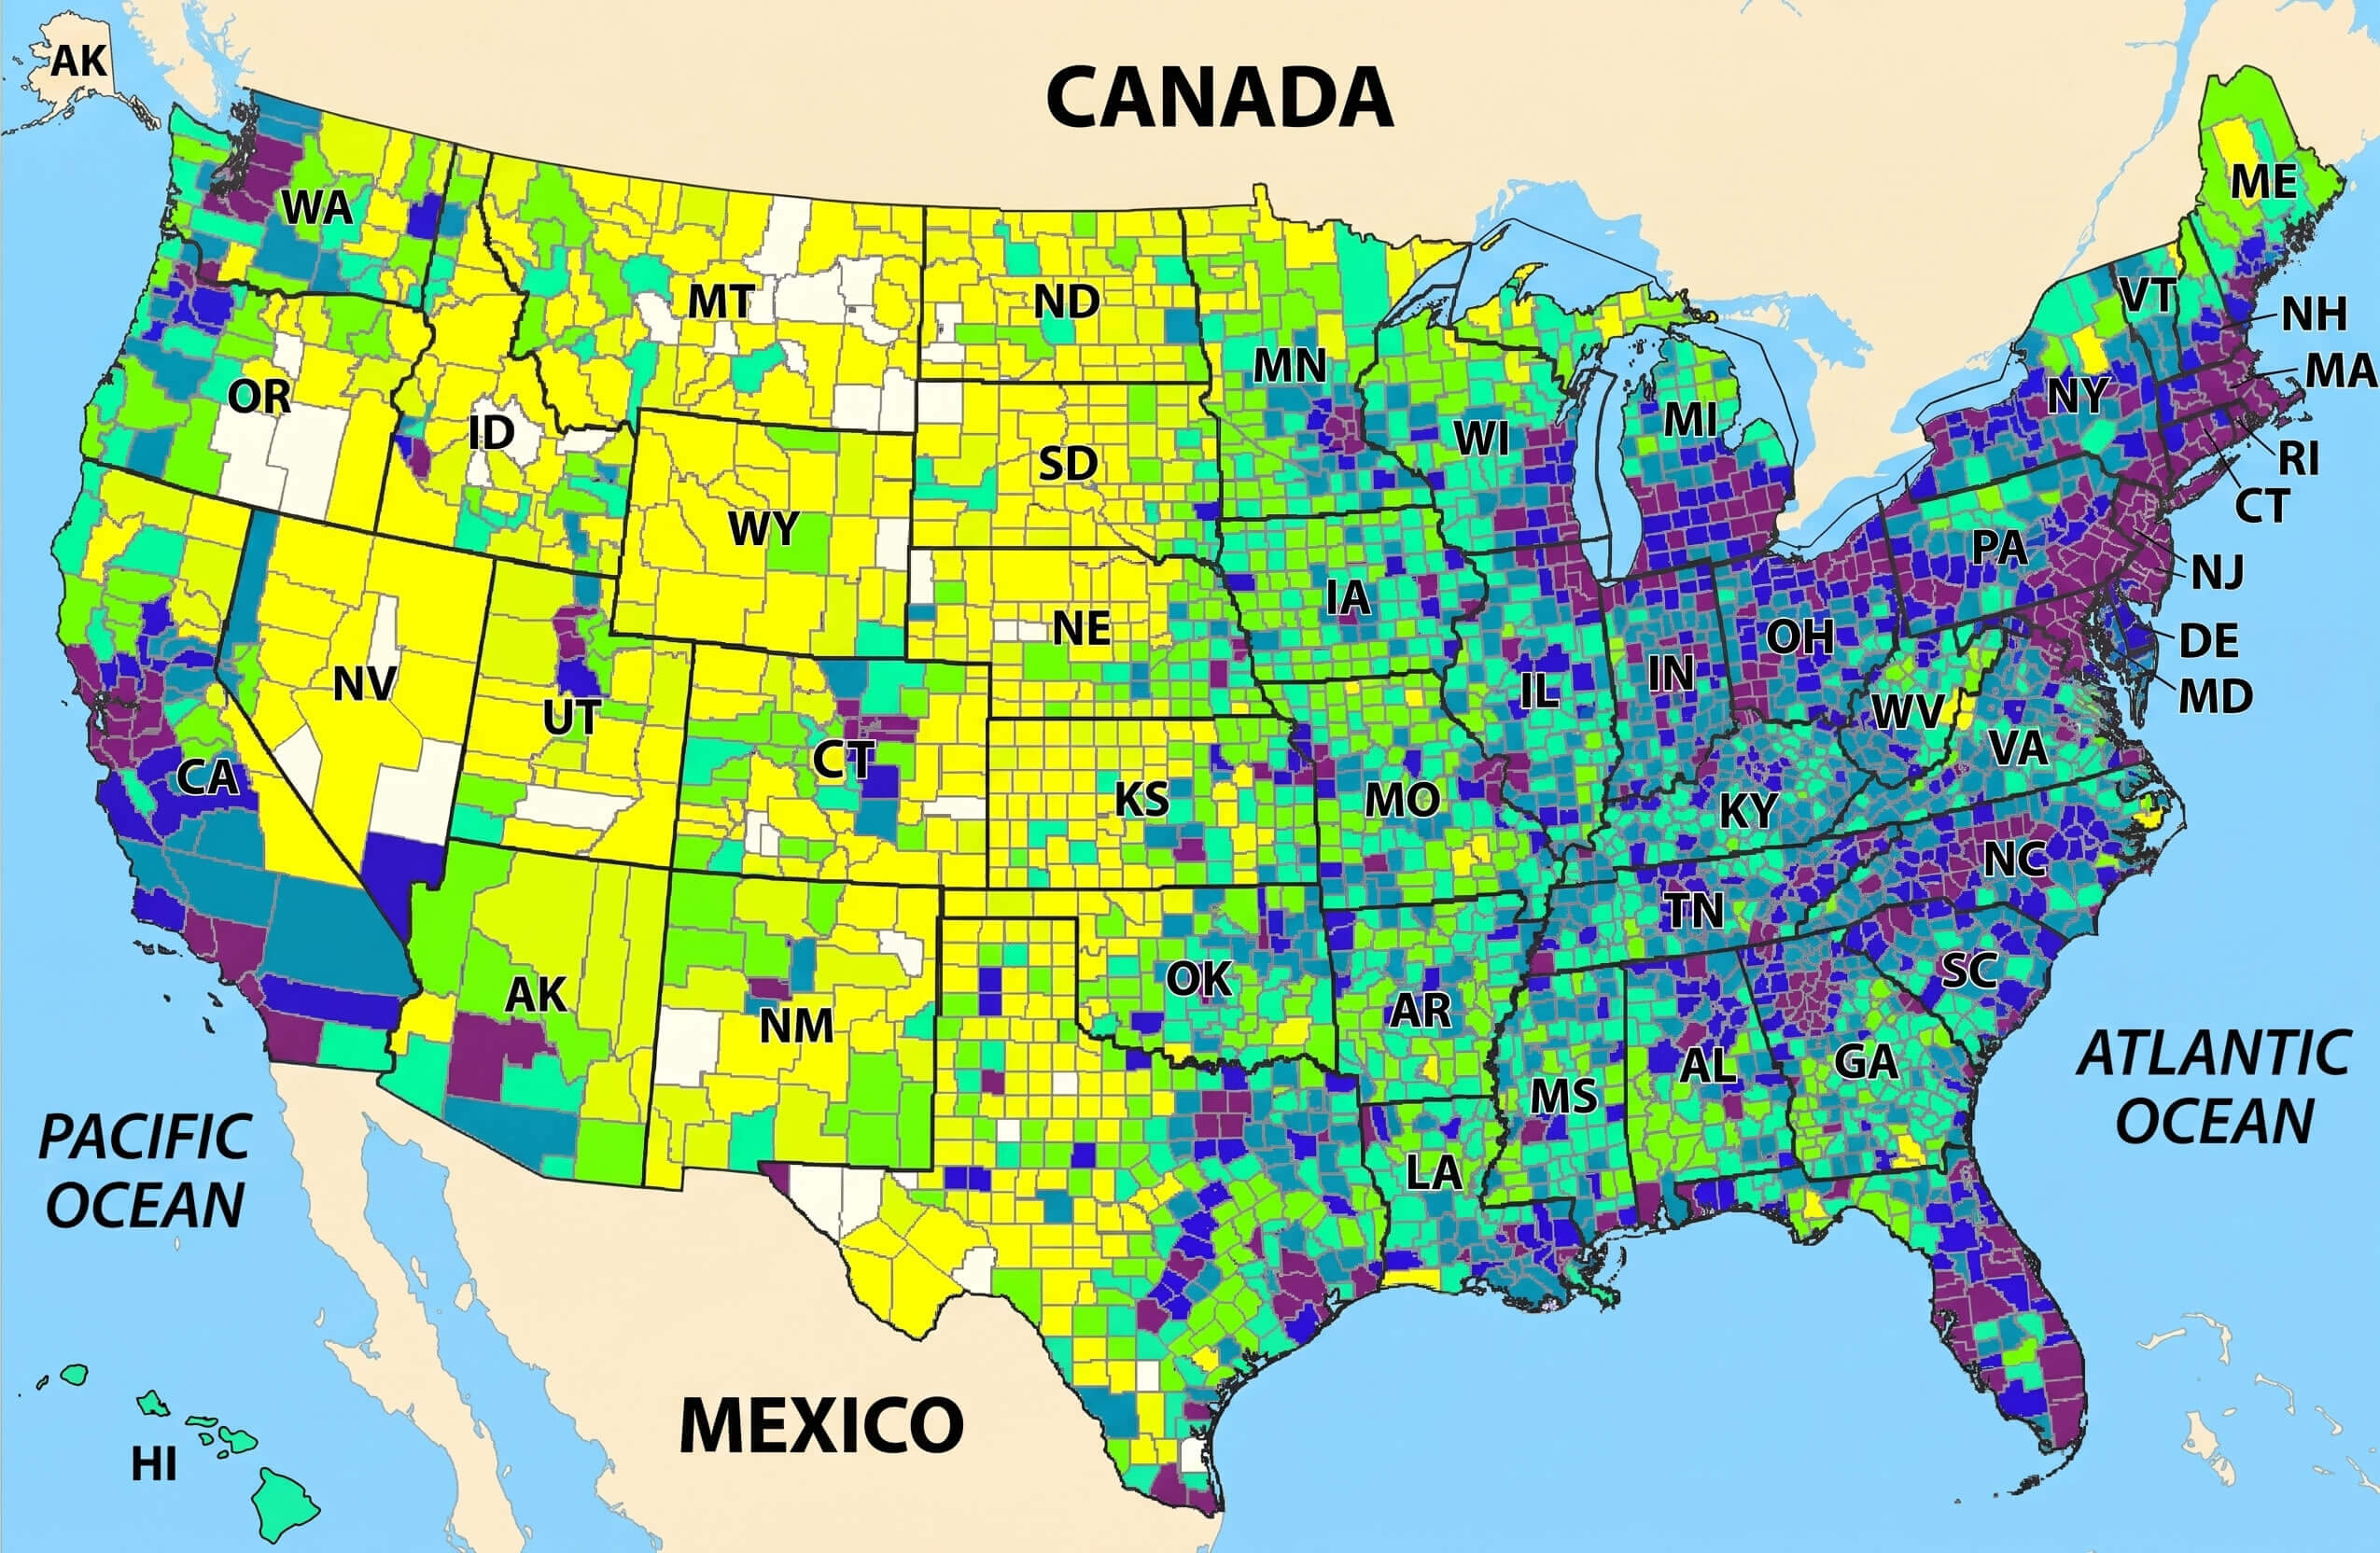
USA county level population density map detailed
USA population density blue gradient map
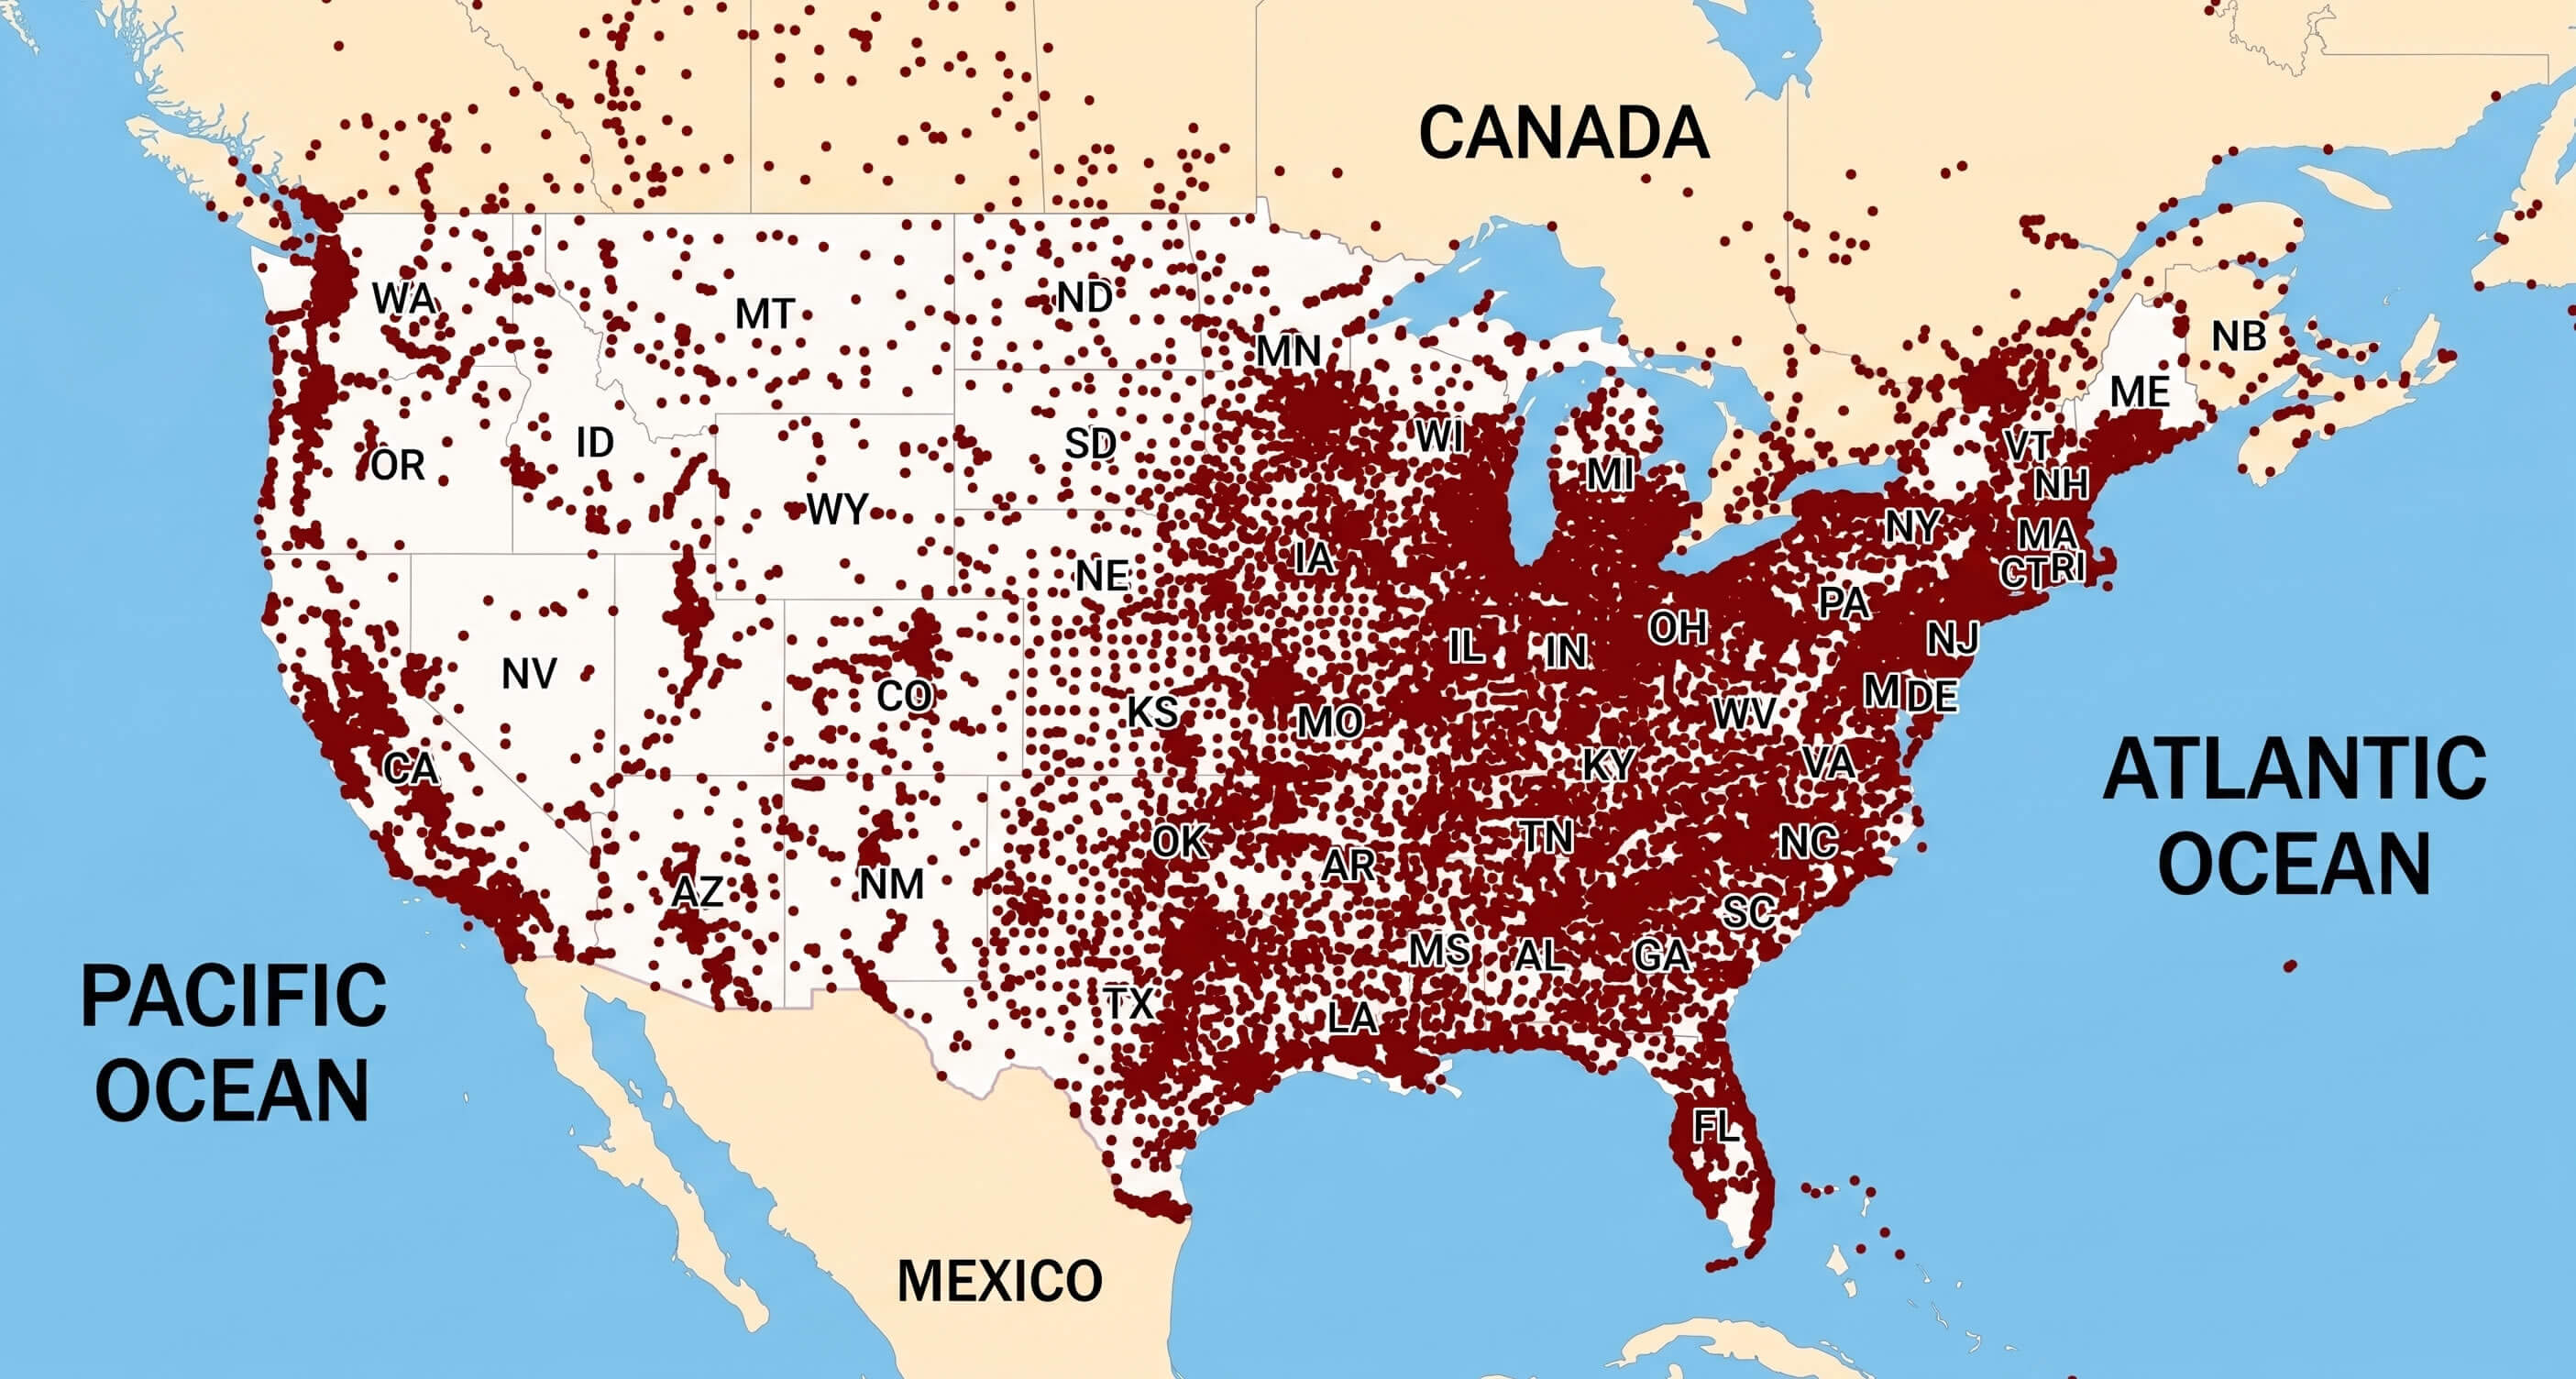
USA population density dot distribution map
USA population density dot map East Coast heavy
USA population density multicolor choropleth map
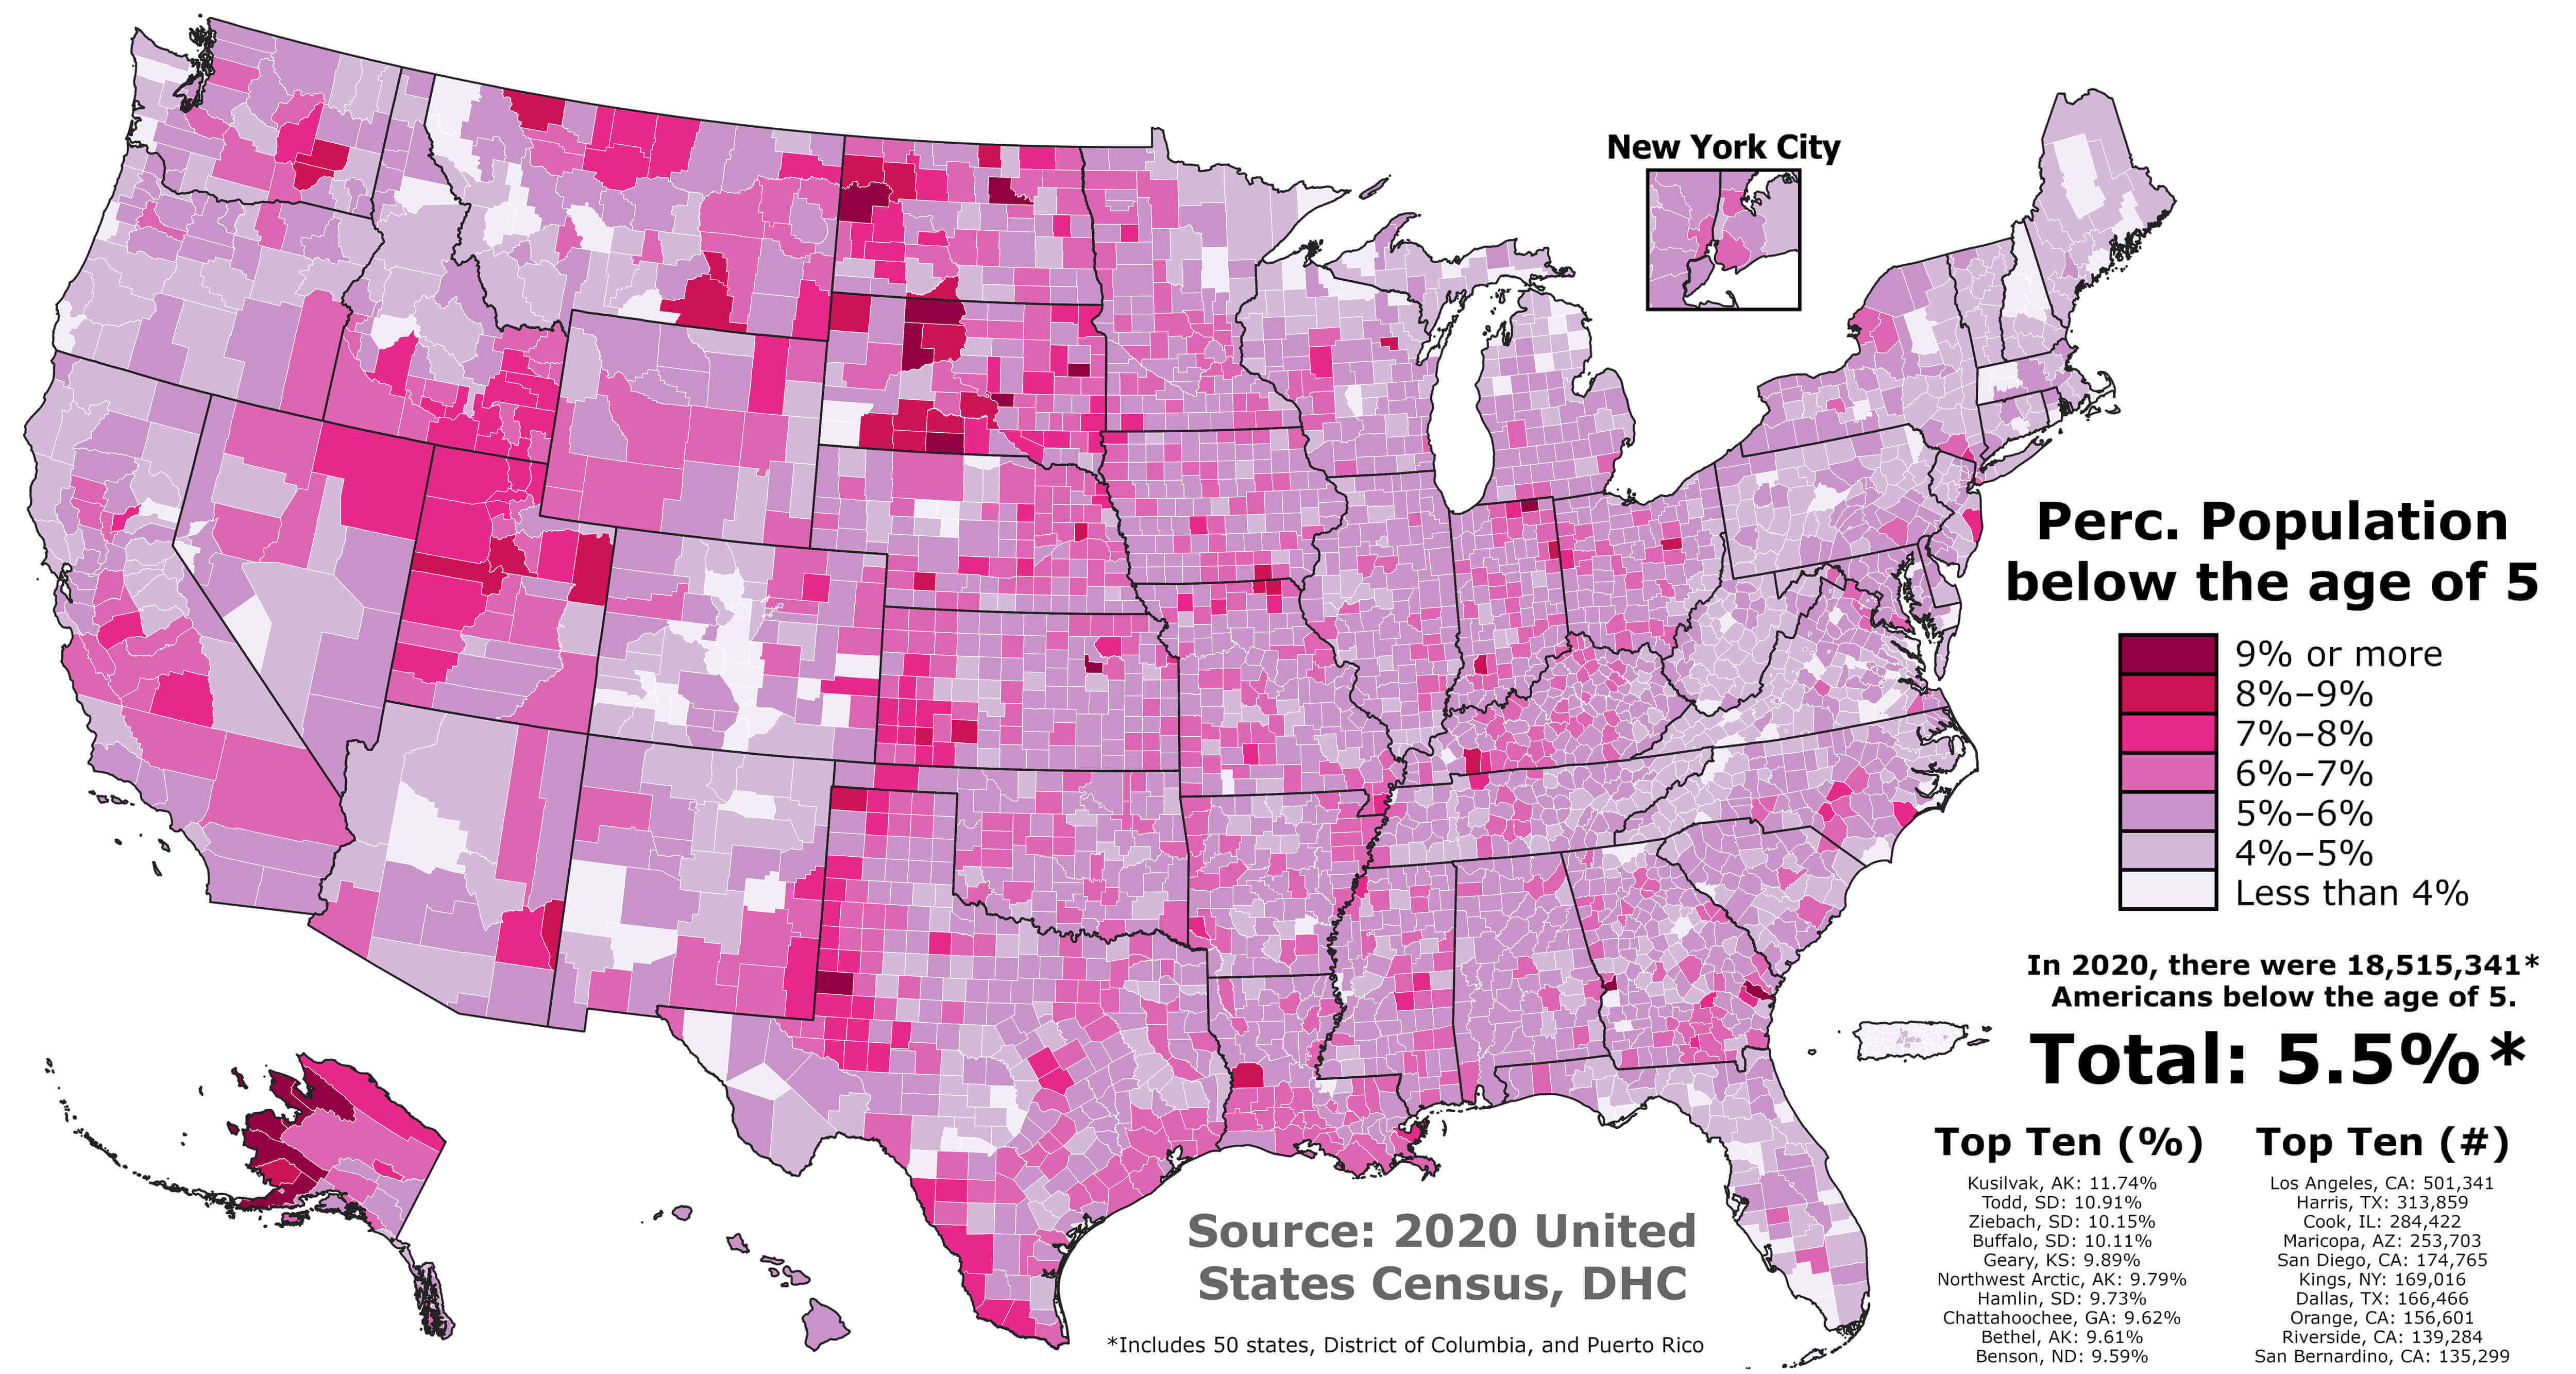
USA population under age 5 map 2020
Feel free to explore these pages as well:
- US Population Map ↗️
- United States Population Map ↗️
- Europe Population Density Map ↗️
- World Population Map ↗️
- Oceania Population Map ↗️
- Explore Africa Population Map ↗️
- United States Population Density Cities Map ↗️
- Explore Asia Population Map ↗️
- What are the largest cities in North America by population ↗️
- South American Population Map ↗️
- Costa Rica Population Density Map 1984 2010 ↗️
- Head of Performance Marketing
- Head of SEO
- Linkedin Profile: linkedin.com/in/arifcagrici